
Figure 6. Pggt1b shapes chromatin accessibility and AP-1 transcriptional programming.
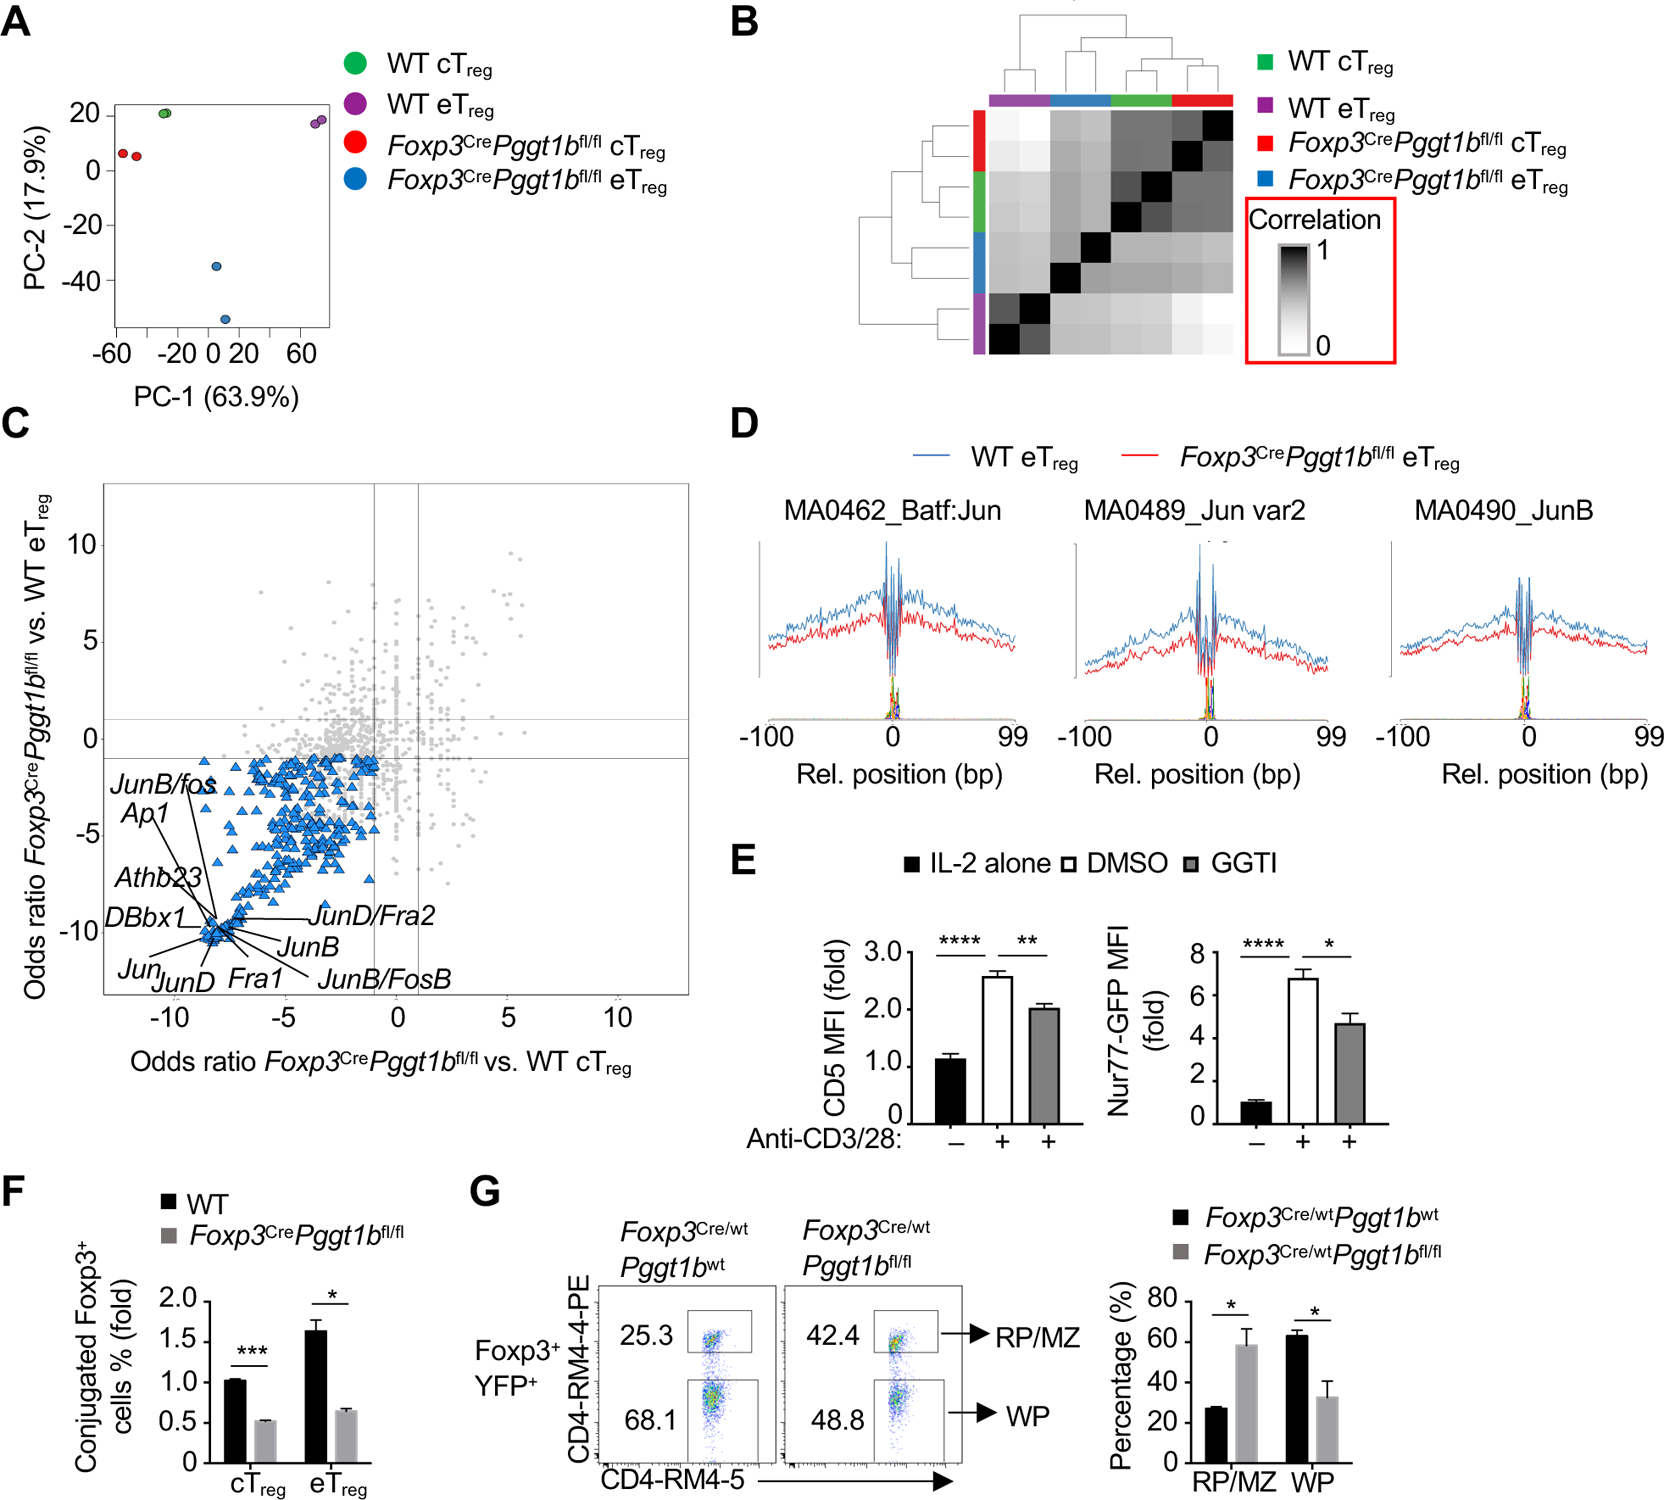
(A) Principal component analysis plot of nucleosome-free reads of cTreg and eTreg cells from WT or Foxp3CrePggt1bfl/fl mixed bone marrow chimeras. (B) Similarity matrix plot of indicated cell populations as in (A). (C) Odds ratio/odds ratio plot of the predicted enriched motifs in Foxp3CrePggt1bfl/fl vs. WT eTreg cells compared with Foxp3CrePggt1bfl/fl vs. WT cTreg as in (A). (D) Binding profiles of Jun family transcription factors in WT or Foxp3CrePggt1bfl/fl eTreg cells as in (A). (E) Quantification of CD5 or Nur77-GFP expression in Foxp3-RFP+ cTreg cells activated by anti-CD3/28 plus IL-2 (or IL-2 alone, black bars) in the presence or absence of GGTI for 24 h. (F) Quantification of conjugate formation of Foxp3-YFP+ cTreg or eTreg cells from WT or Foxp3CrePggt1bfl/fl mice co-cultured with Celltrace Violet-labeled DCs in the presence of IL-2 for 10 h. (G) Flow cytometry analysis and quantification of the frequency of Foxp3+YFP+ Treg cells from WT or Foxp3Cre/wtPggt1bfl/fl ‘mosaic’ mice found in the red pulp/marginal zone(RP/MZ; CD4-RM4–5+CD4-RM4–4-PE+) or white pulp (WP; CD4-RM4–5+CD4-RM4–4-PE−).
Data are representative of two (E), or compiled from two (F, G) independent experiments, with three (E, G) or at least two (F) biological replicates per group. *p < 0.05, **p < 0.01, ***p < 0.001, ****p < 0.0001; two-tailed unpaired Student’s t-test (F, G) or one-way ANOVA (E). Data are mean ± s.e.m. Numbers indicate percentage of cells in gates. Controls were normalized to 1 for each comparison (black bars). See also Figure S6.