
Figure 7. Rac is essential for eTreg-cell differentiation and immune homeostasis.
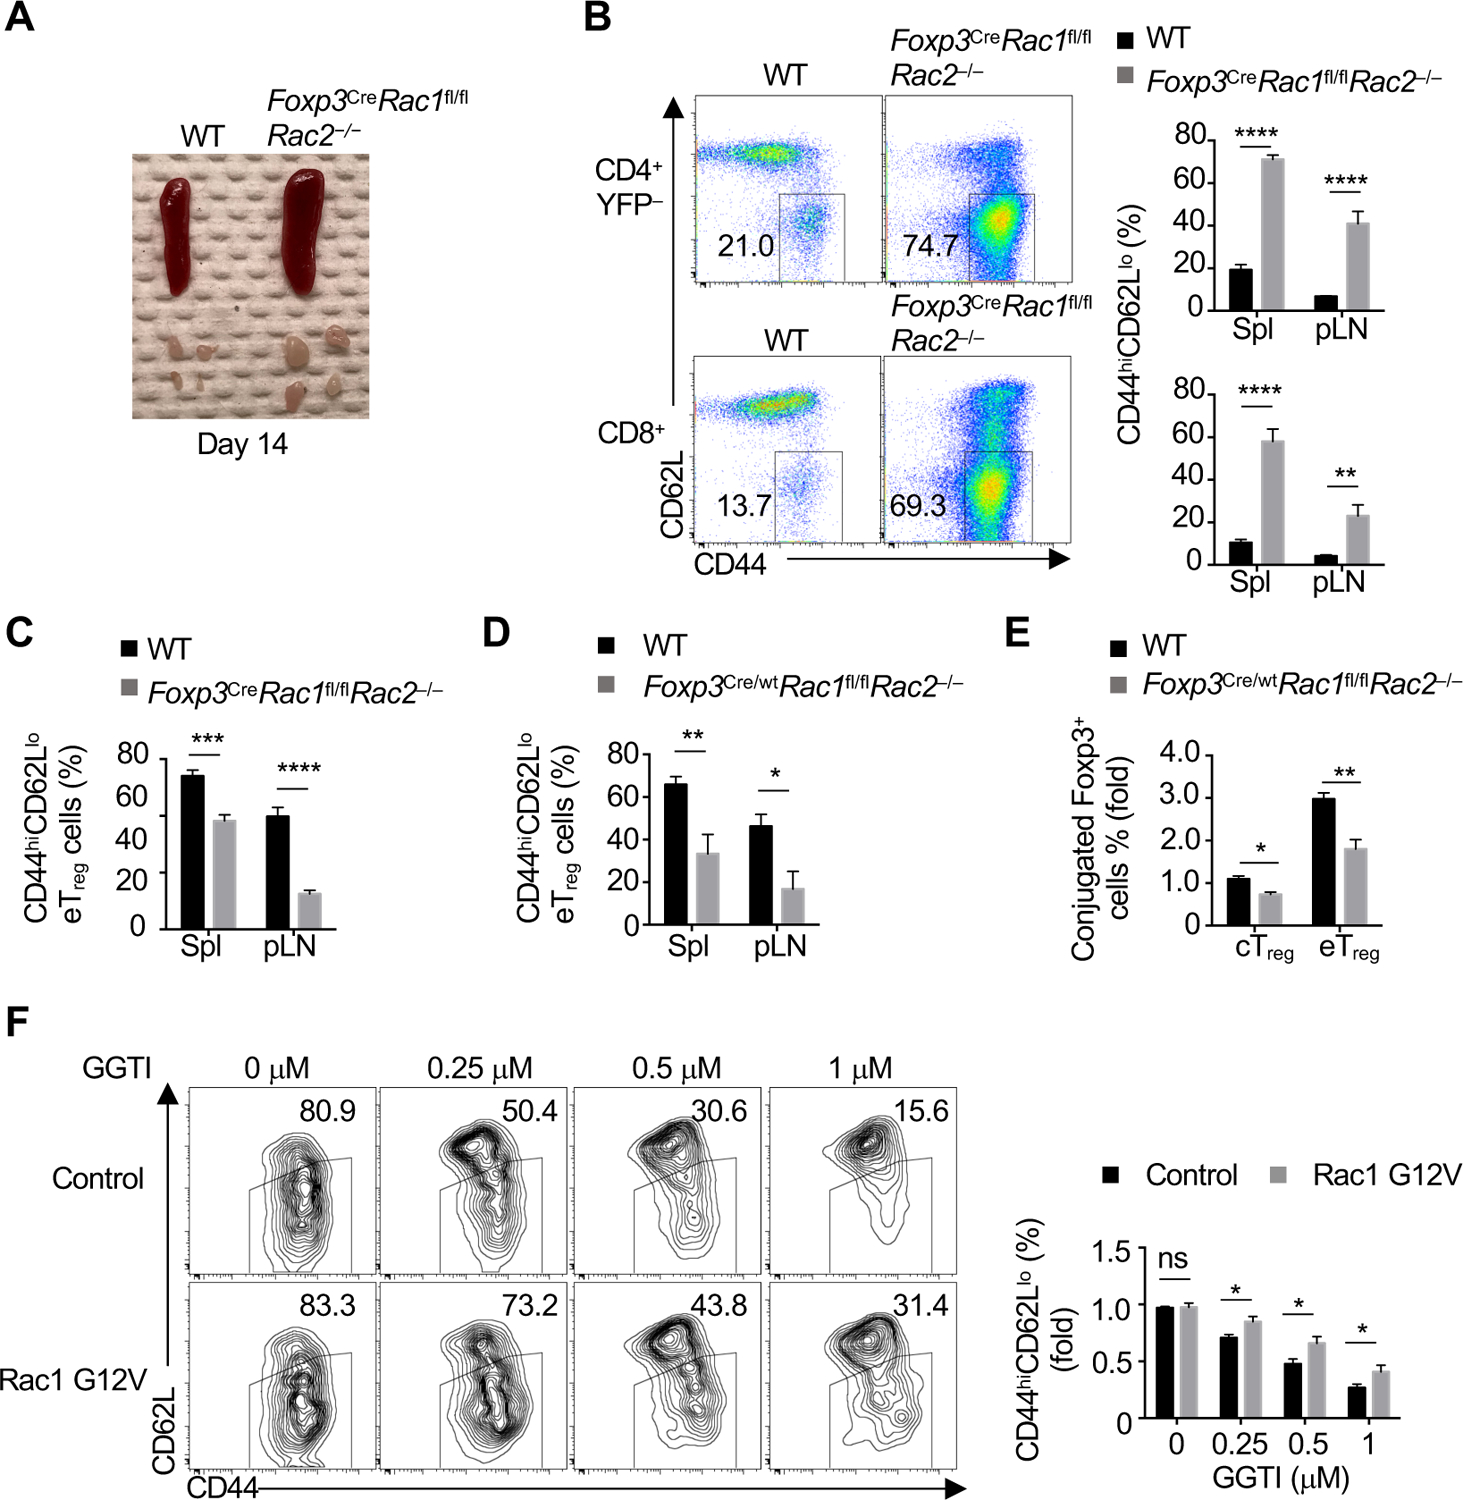
(A) Representative images of enlarged spleen and peripheral lymph nodes (pLN) in WT and Foxp3CreRac1fl/flRac2−/− mice. (B) Flow cytometry analysis (spleen) and quantification of the frequency of CD44hiCD62Llo CD4+Foxp3-YFP− or CD8+ T cells in the spleen (Spl) and pLN of indicated mice. (C) Quantification of the frequency of CD4+Foxp3-YFP+ eTreg cells in the Spleen and pLN of WT and Foxp3CreRac1fl/flRac2−/− mice. (D) Quantification of eTreg cell frequency in indicated organs of WT and Foxp3Cre/wtRac1fl/flRac2 −/− ‘mosaic’ mice. (E) Quantification of conjugate formation of Foxp3-YFP+ cTreg or eTreg cells from indicated ‘mosaic’ mice co-cultured with Celltrace Violet (CTV)-labeled DCs after co-culture in the presence of IL-2 for 10 h. (F) WT cTreg cells activated by anti-CD3/28 for 18 h were transduced with retrovirus expressing empty vector control or Rac1 G12V vector. After resting, CTV-labeled transduced cells pretreated with the indicated doses of GGTI for 2 h were activated with anti-CD3/28 plus IL-2 for 3 days. Flow cytometry analysis and quantification of eTreg-like cell generation.
Data are representative of three (A), or compiled from three (B and C), two (D-E) or three (F) independent experiments, with 7–8 (B, C), 3–5 (D, E) or 10–11 (F) biological replicates per group. *p < 0.05, **p < 0.01, ***p < 0.001, ****p < 0.0001; ns, not significant; two-tailed unpaired Student’s t-test (B–F). Data are mean ± s.e.m. Numbers indicate percentage of cells in gates. Controls were normalized to 1 for each comparison (black bars). See also Figure S7.