FIGURE 4.

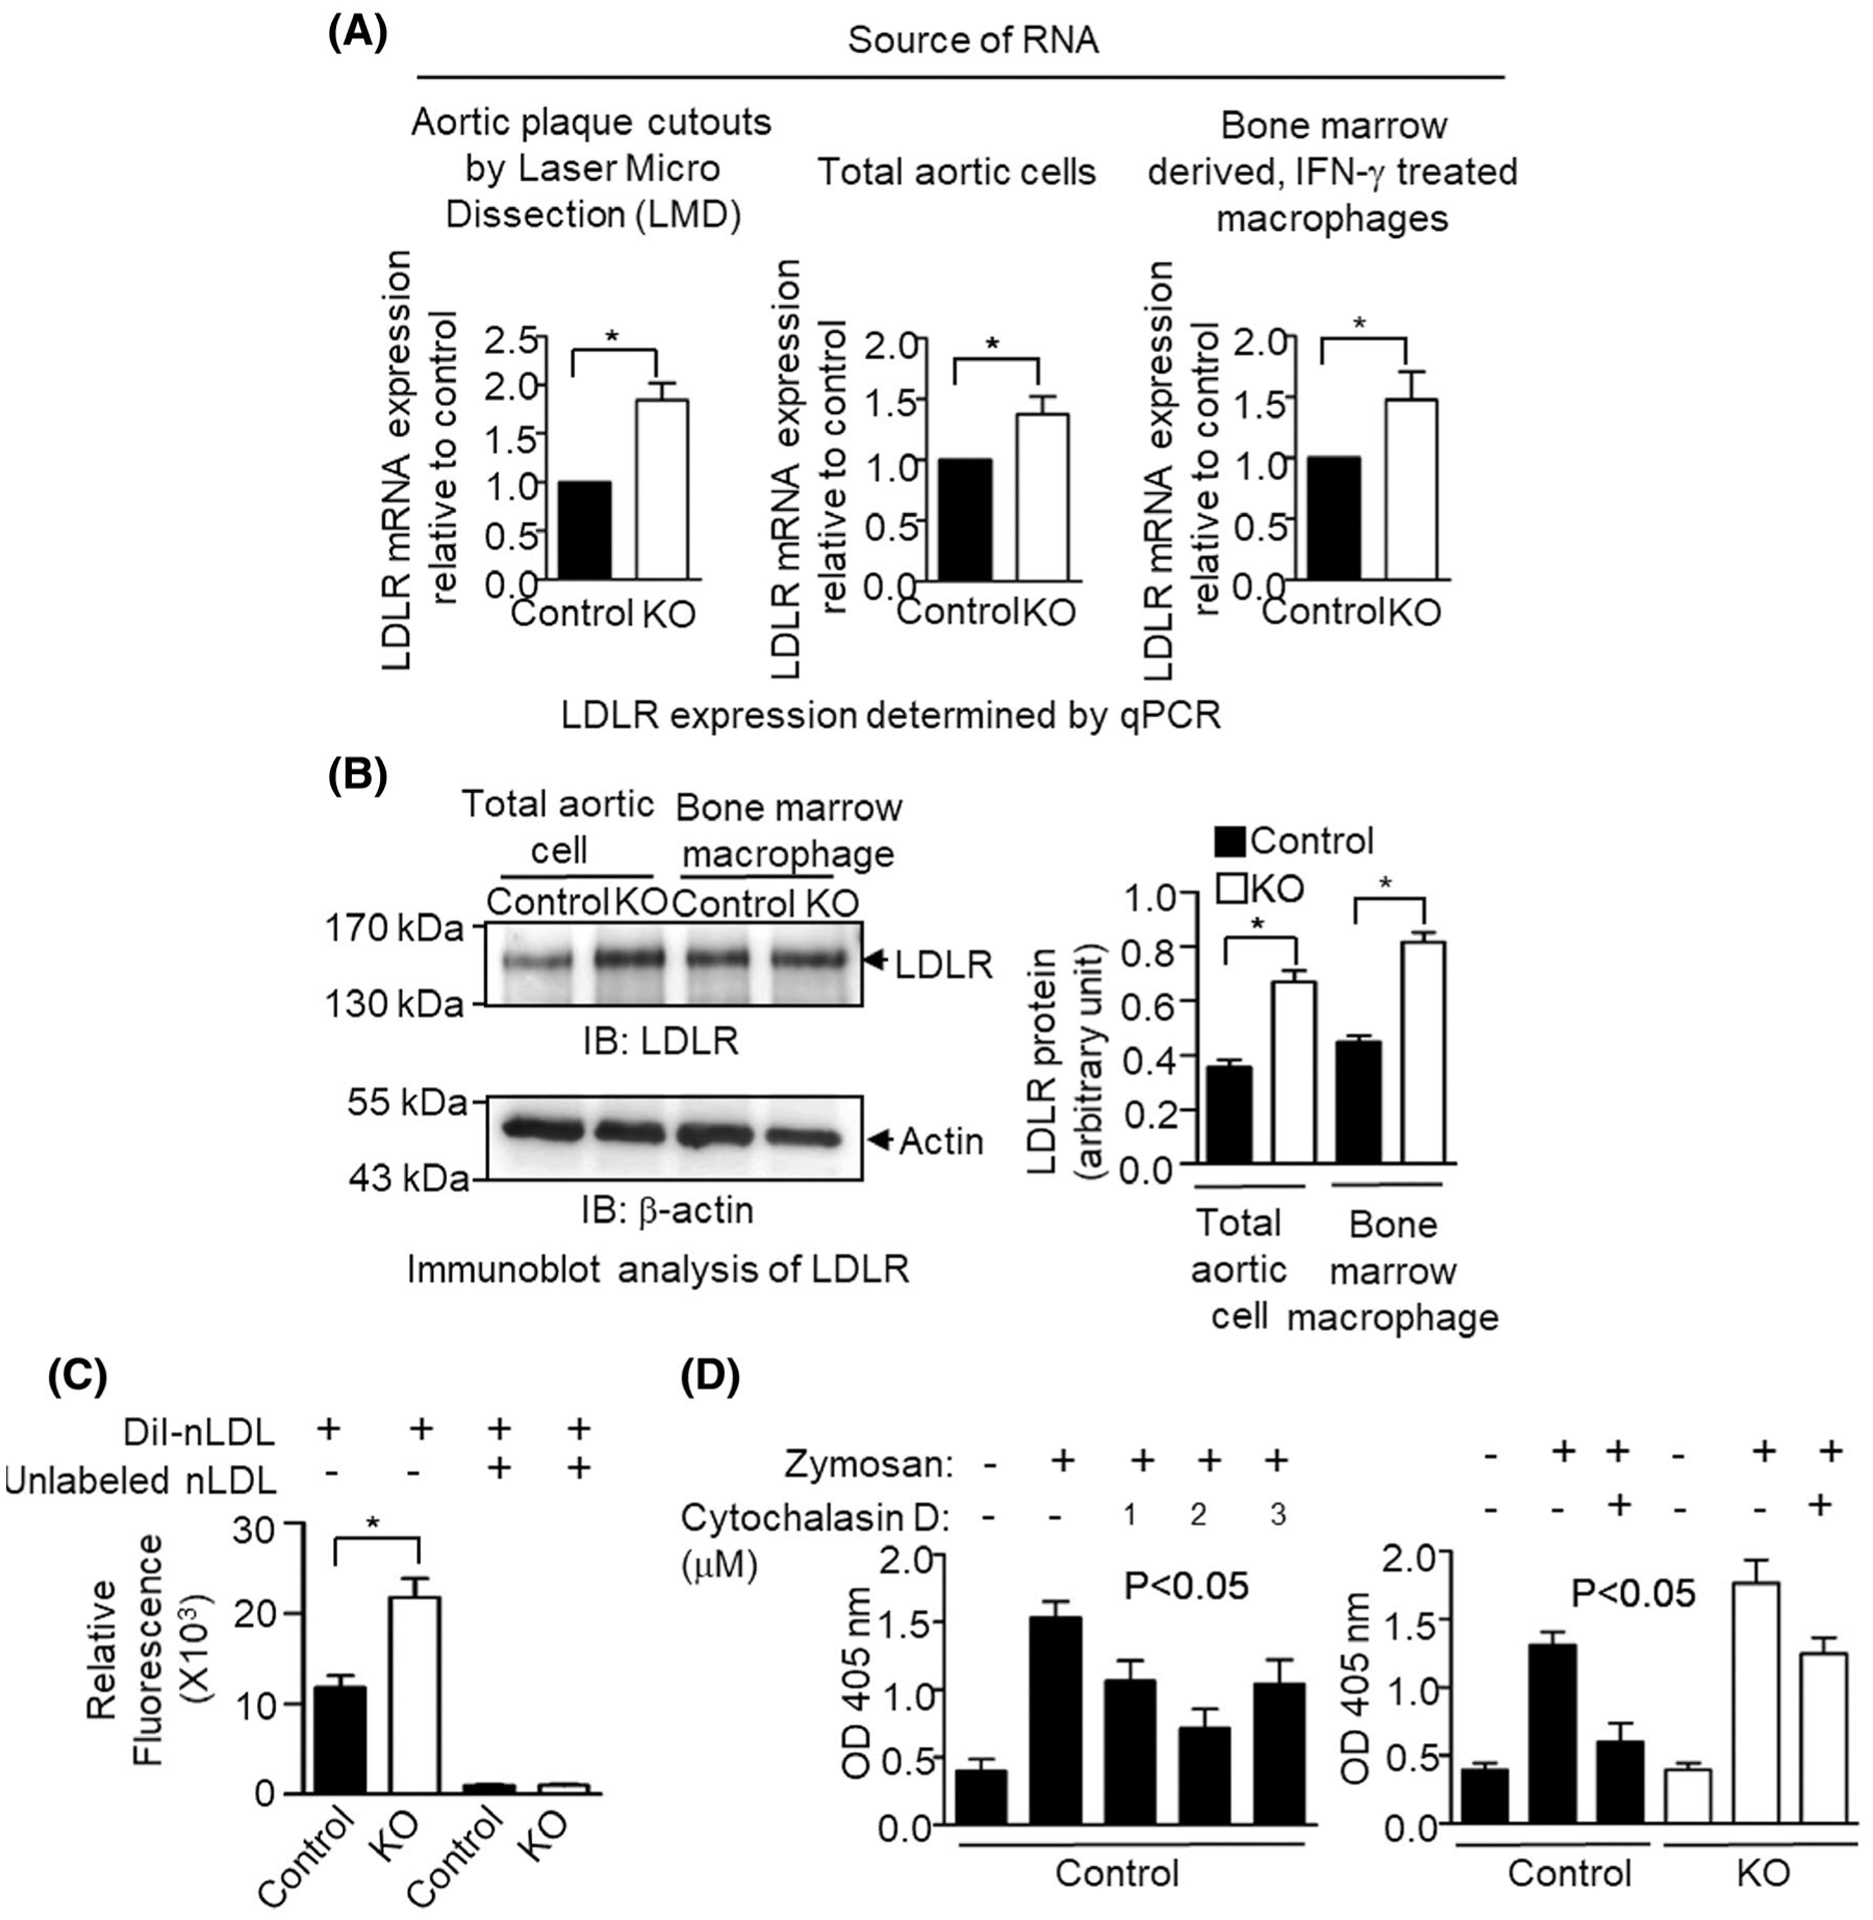
Effect of inflammatory stimulation on low-density lipoprotein receptor (LDLR) expression and phagocytic activity in L13a deficient mouse macrophage. A, Mice were kept on a HFD for 14 weeks, after which LDLR mRNA levels were determined by real-time quantitative RT-PCR in RNA preparations from laser microdissected aortic plaque cutouts and total aortic cells. Simultaneously, LDLR mRNA levels were also checked in IFN-γ stimulated bone marrow-derived macrophage cells. B, Left, Western blot analysis of LDL receptor protein expression. Lysates were prepared from either IFN-γ stimulated bone marrow-derived macrophages or total aortic cells from HFD-fed control and KO mice. Protein lysates were subjected to Western blot by anti LDLR antibody. Right, Densities of the LDLR bands in the blot after normalization with the internal invariable control beta-actin. C, Internalization of native low-density lipoprotein (nLDL) by bone marrow-derived macrophages. IFN-γ treated control and L13a KO macrophages were incubated with DiI-labeled nLDL for 4 hours at 37°C before the determination of relative fluorescence. Specificity of internalization was checked by preincubating cells with unlabeled nLDL before adding Dil-nLDL. Data represent mean ± SD, n = 3, * P ≤ .05. D, Increased phagocytic activity of L13a deficient bone marrow-derived macrophages (BMM). Left panel, determination of phagocytosis inhibitor (Cytochalasin D) concentration for BMM. 50 000 control BMM cells/well were seeded overnight in a 96-well plate. Cytochalasin D was used to pretreat for 1 hour at 37°C before addition of Zymosan particles at 50:1 ratio. Phagocytosis was stopped after 30 minutes and the amount of engulfed Zymosan particles was determined. Right panel, control, and L13a deficient BMM were pretreated with IFN-γ for 24 hours before adding zymosan particles in the presence or absence of Cytochalasin D. In A and B, results are expressed as mean ± SD, n = 3. *P ≤ .05 compared with the control group. In C, 1-way ANOVA was used for statistical analysis
