
Figure 2.
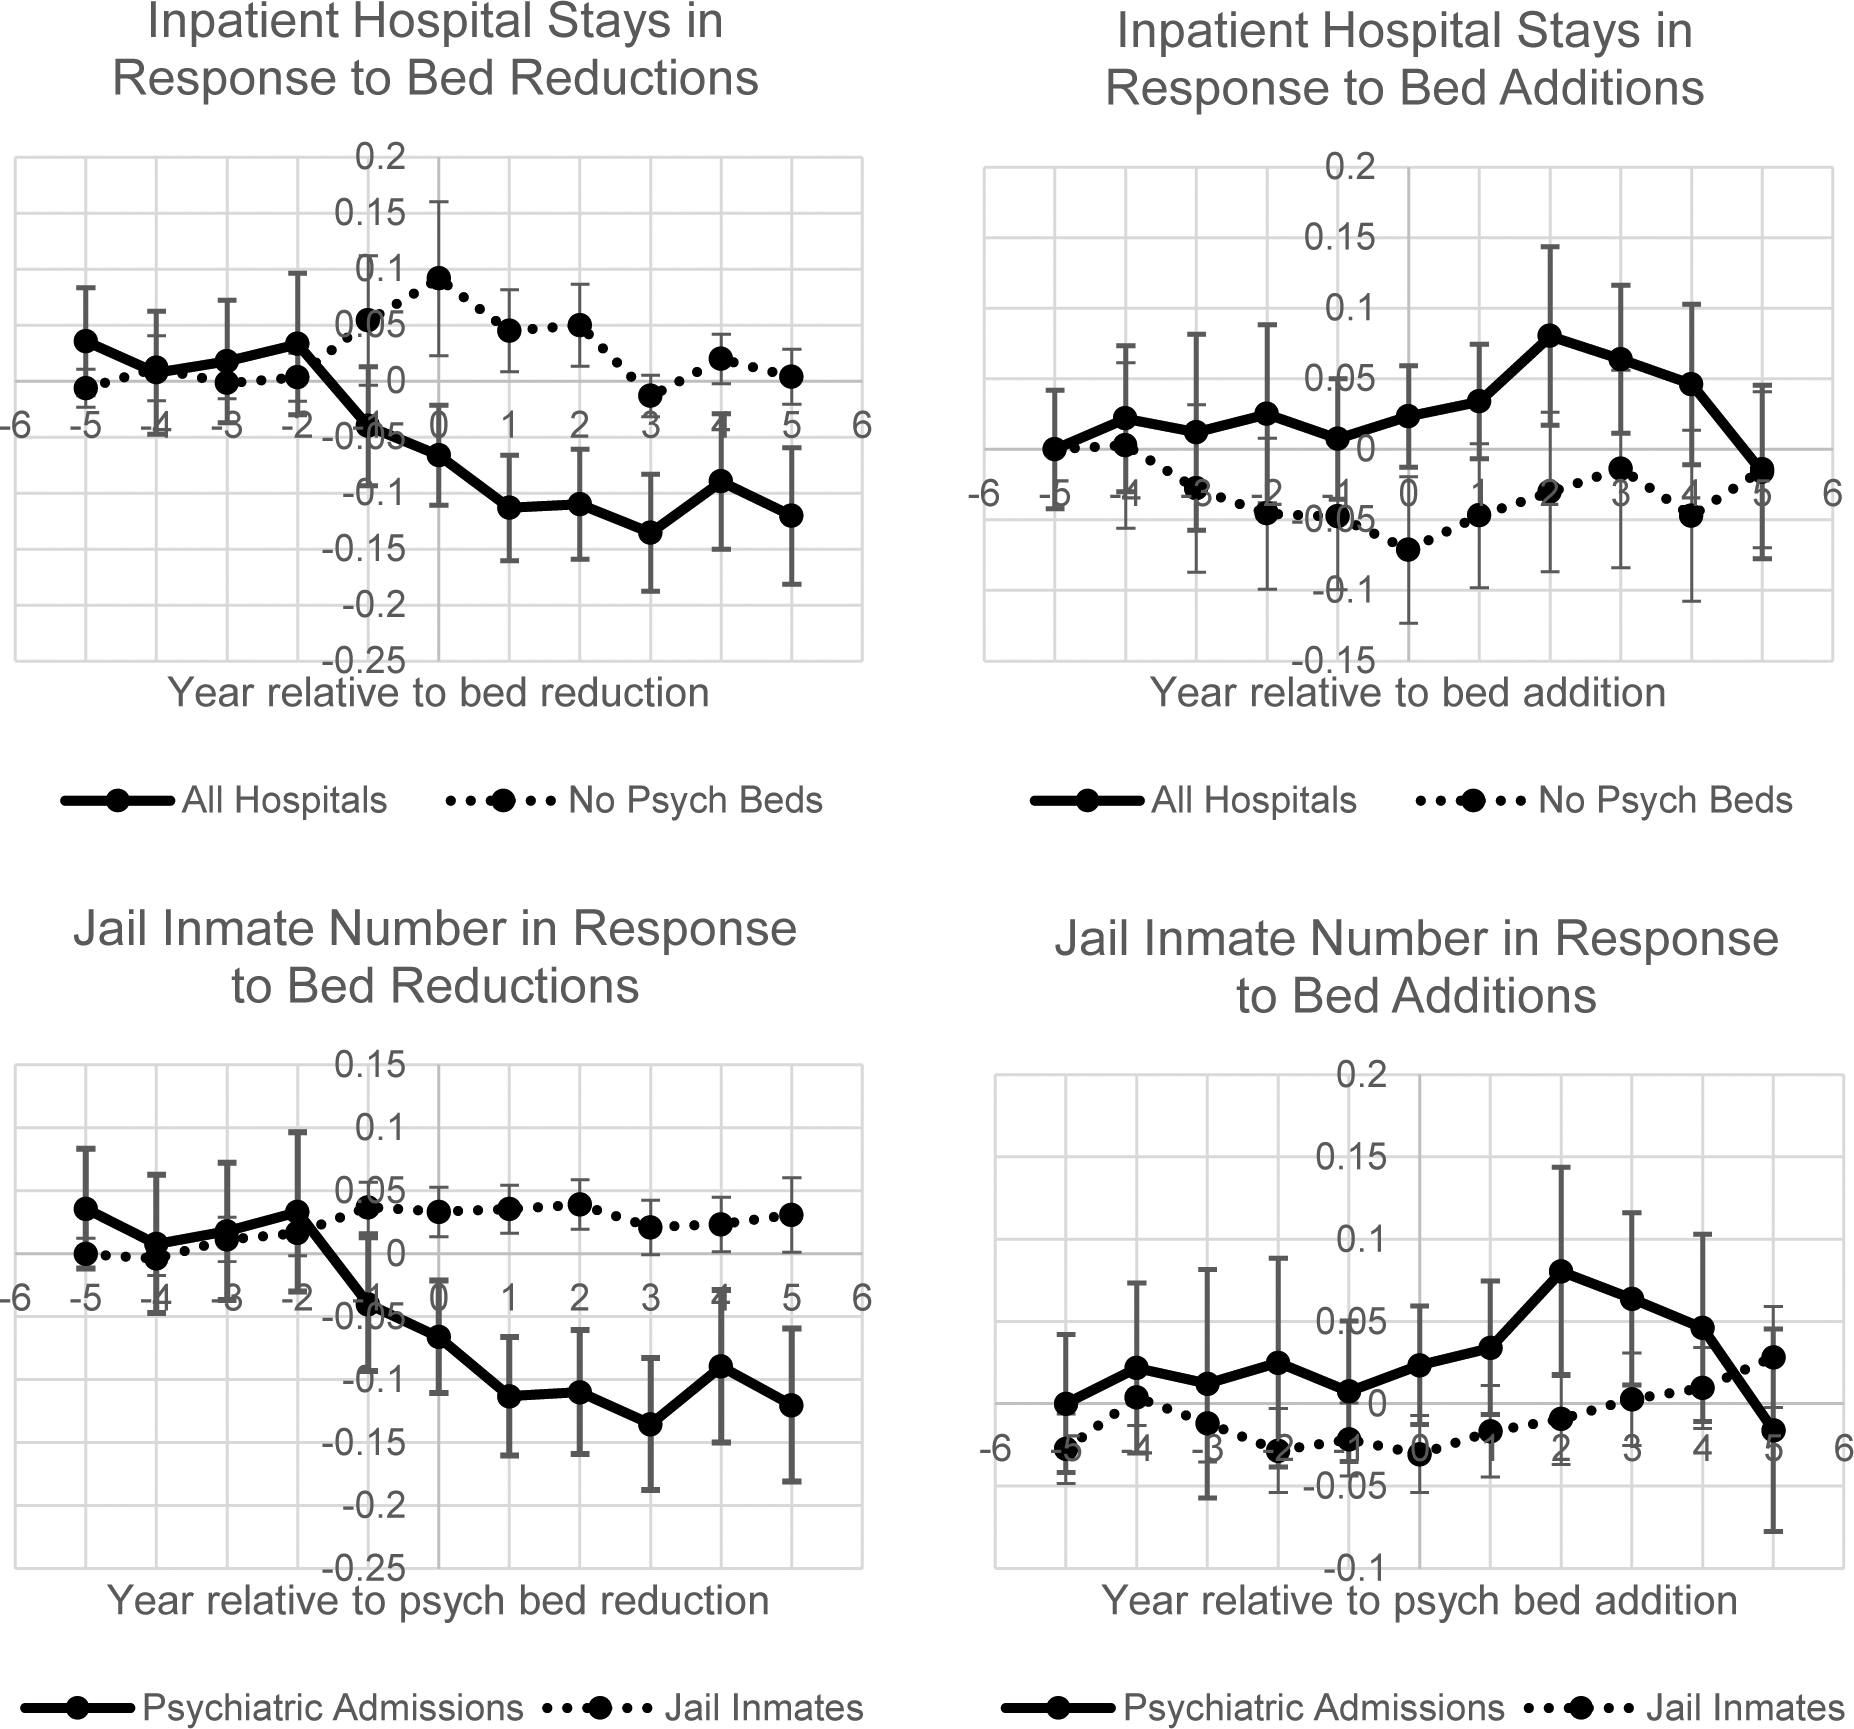
Changes in psychiatric inpatient admissions to general hospitals and jail inmate population observed around the timing of abrupt changes to the local psychiatric bed supply.
The plotted lines represent average admissions volumes for psychiatric diagnoses within an HRR relative to the year of identified discontinuity (x-axis zero). Left: bed reductions. Right: bed additions. In both panels the solid line represents the standardized index for psychiatric admissions within the HRR. In both panels above, the dotted line represents the standardized number of psychiatric admissions to hospitals with no reported psychiatric beds. In the panels below, the dotted line represents the standardized number of jail inmates. The x-axis points −5, −4, −3, −2, −1, 0, 1, 2, 3, 4 correspond to the average number of beds observed in years 5, 4, 3, 2, 1 years before the change, in the year of the change and 1, 2, 3, 4 years afterwards. The x-axis point 5 is the aggregated effect observed across all years subsequent to 4 years after the change. Standard errors given by error bars. All 95% confidence intervals contain zero.