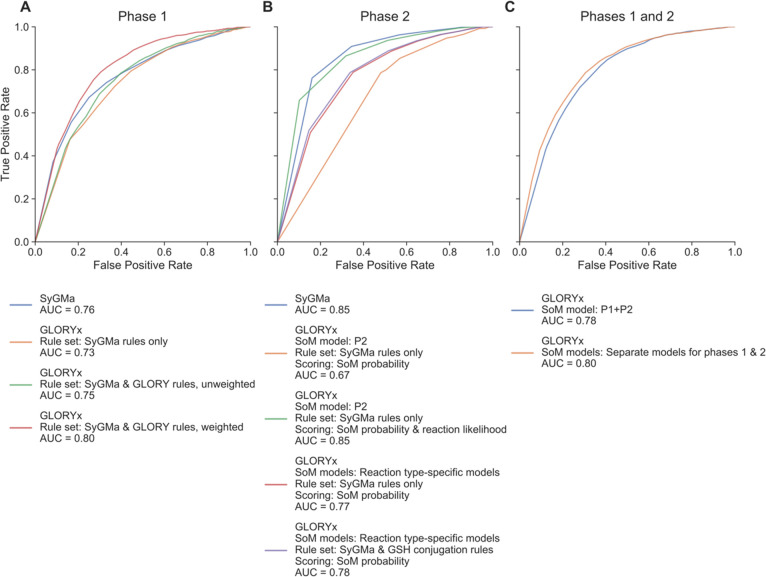
Figure 2.
Rank-based ROC curves for the evaluation of metabolite prediction performance on the reference data set. The ranks are calculated based on the priority scores of the predicted metabolites for each parent molecule. (A) Comparison of GLORYx, which scores its predicted metabolites based on predicted SoM probabilities, to SyGMa, which uses reaction probability scores, for phase 1 metabolite prediction. Weighted rules refer to the weighting of the SoM probability-based score based on whether the reaction type is designated common or uncommon. (B) Comparison of the ranking performance of GLORYx with different scoring approaches and rule sets as well as direct comparison to SyGMa’s performance, for phase 2 metabolite prediction. The scoring approach that is based on both SoM probability and reaction probability is achieved by a simple multiplication of the two components. (C) Comparison of the ranking performance of GLORYx for combined prediction of metabolites for phases 1 and 2 metabolism, using different SoM prediction approaches to score the predicted metabolites. In both cases, the score is based on predicted SoM probability with weighting according to reaction type, and the rule set is made up of the final phase 1 rule set (SyGMa and GLORY rules) and final phase 2 rule set (SyGMa and GSH conjugation rules).

