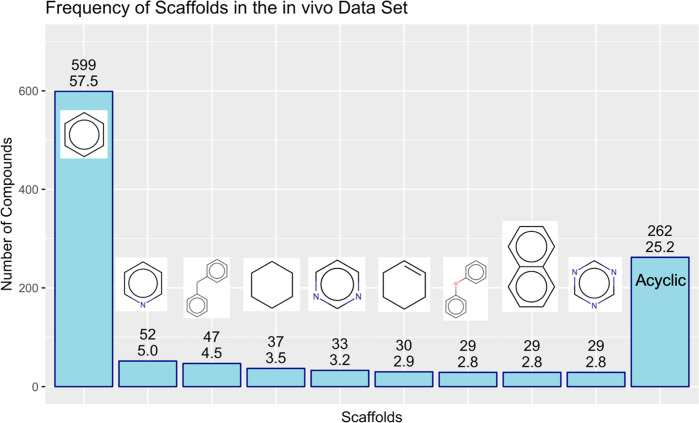
Figure 3.
Bar plot showing the most frequent Bemis–Murcko scaffolds (occurring in at least 20 compounds) in the in vivo steatosis data set (TR and TS). Absolute numbers of compounds possessing the respective scaffold (upper numbers) and relative percentages of frequencies within the data set (lower numbers) are indicated. The proportion of acyclic compounds in the data set is indicated by the outer right bar.

