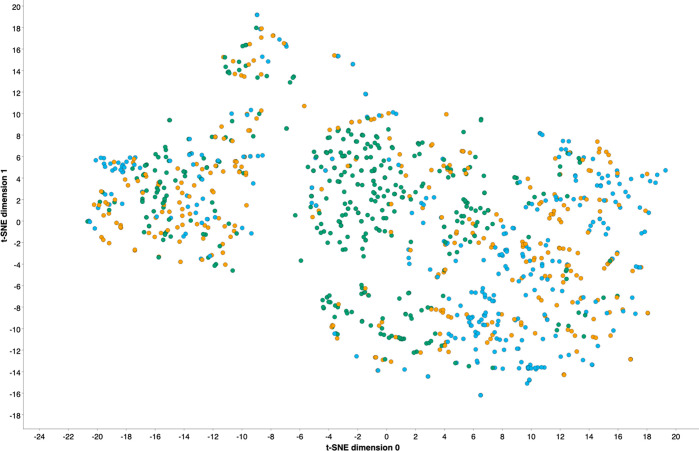
Figure 5.
Two-dimensional t-SNE projection of the in vivo steatosis data set (TR and TS compounds): The chemical space projection is based on 26 physicochemical RDKit descriptors. The color code indicates compounds which have been predicted by the CP framework based on these RDKit features (at significance level 0.3) to belong to either the “high” (= steatotic), “low”(= nonsteatotic), or “both” classes (colored in light blue, green, and brown, respectively).

