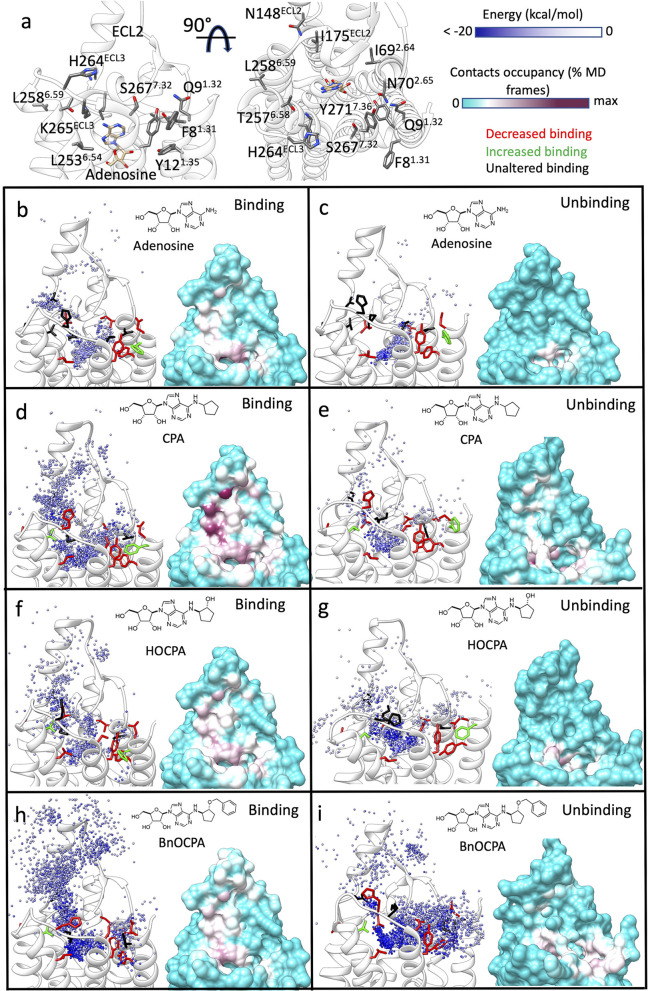
Figure 3.
Simulated binding and unbinding paths of the agonists and the relative position of the A1R mutants tested. (a) Two side views of the A1R (white transparent ribbon); residues considered for the mutations (Table 2) are shown as gray sticks. The cryo-EM bound adenosine (tan stick) is reported as reference. (b–i) Left-hand panels, position of the agonist centroid during simulations, colored according to the interaction energy with A1R (white ribbon); residues mutated (Table 2) are shown as sticks and colored according to effect on the affinity (red, decreased affinity; green, increased affinity; black, unaltered affinity). Right-hand panels, A1R-agonist contacts plotted onto the protein surface and colored according to the contacts occupancy. (b) Adenosine binding simulations, (c) adenosine unbinding simulations, (d) CPA binding simulations, (e) CPA unbinding simulations, (f) HOCPA binding simulations, (g) HOCPA unbinding simulations, (h) BnOCPA binding simulations, (i) BnOCPA unbinding simulations.

