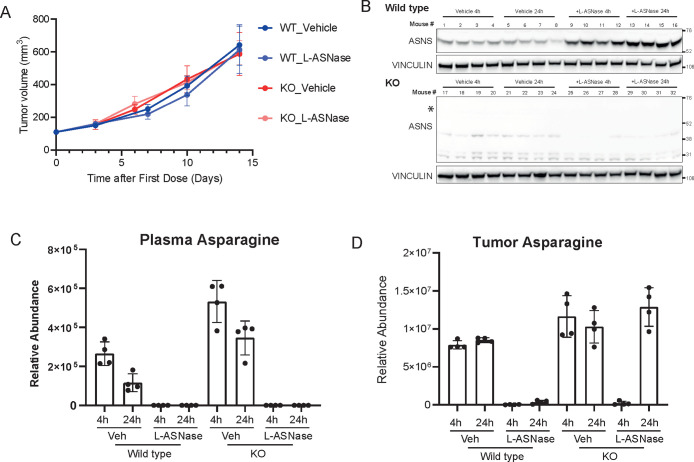
Figure 2.
(A) Tumor volumes (y-axis) of A2058 WT and KO cells implanted subcutaneously in nude mice and treated or untreated with l-asparaginase. N = 5 per group and error bars represent SEM. (B) Western blot analysis of the tumors harvested from experiment in Figure 2A at the end point. (C–D) Relative abundance of asparaginase in plasma (C) and tumors (D) from mice of experiment in Figure 2A at 4 h and 24 h after l-asparaginase injection at day 7.

