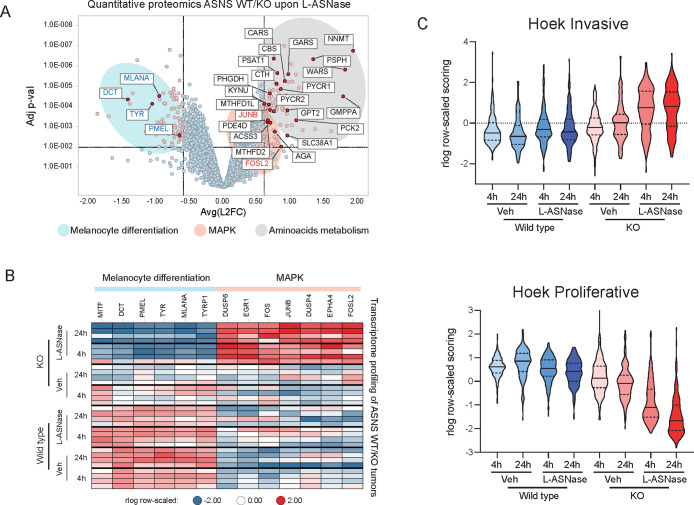
Figure 3.
(A) Volcano plot representing the Log FC (x-axis) and adjusted p-value (y-axis) of quantitative proteomics data comparing tumors ASNS KO treated with L-ASNase and matching wild type tumors with the same treatment (each dot represents the average for each protein. N = 4 per group). Black/red/blue gene names represent genes involved in amino acid metabolism, MAPK pathway and melanocyte differentiation, respectively. (B) Heatmap of RNA expression levels (as measured by RNA-seq) of genes belonging to melanocytic differentiation or MAPK from each individual tumors from experiment in Figure 2A. (C) Violin plot representing the aggregated expression of signatures reported by 15 indicating the “invasive” (top panel) or “proliferative” (bottom panel) status of melanoma tumors.

