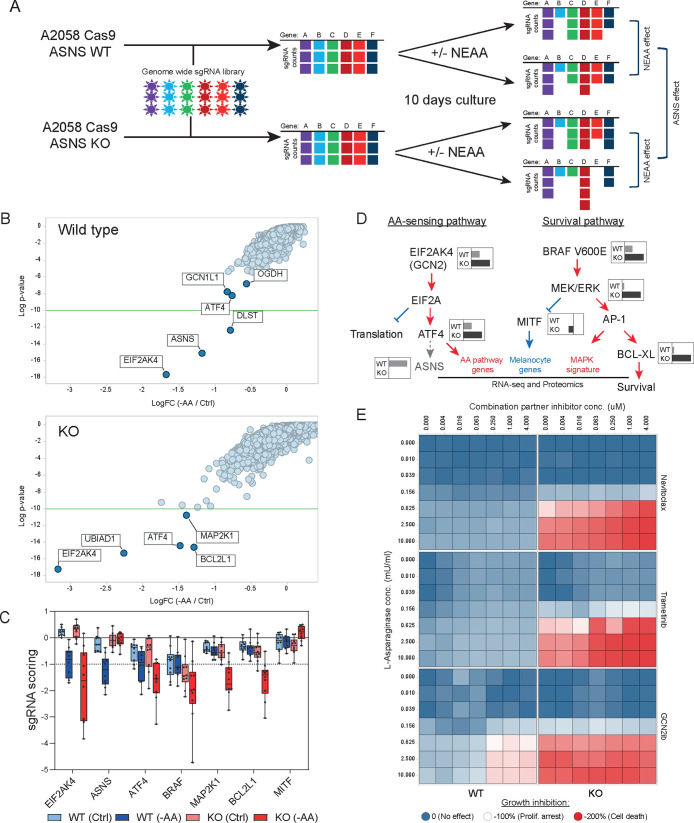
Figure 4.
(A) Schematic outline of the genome wide CRISPR screen in A2058 ASNS WT and KO cells upon NEAA level manipulation. (B) Results from genome wide CRISPR screens. Data from WT (top panel) and KO (bottom panel) cells were represented as LogFC (x-axis) for each cell line grown either in full media or in NEAA-deprived media. Y-axis represents the Log p-value of significance. (C) sgRNA representation (Y-axis) for the individual sgRNAs targeting hits identified in the CRISPR screen from Figures 4A and S3E. (D) Diagram summarizing findings from CRISPR screening and proteomic and transcriptomic analyses. Key players in AA-sensing and survival pathways are represented. Gray/black inlets show representative LogFC sensitivity as detected by the CRISPR screen in ASNS WT or KO cells as per Figure 4B. Red/blue writings and arrows represent pathways up/down regulated in ASNS KO cells upon L-ASNase treatment. (E) Heatmap representing the cell viability (as measured by Cell Titer Glo) of WT (left column) and KO (right columns) A2058 cells treated with increasing concentration of l-asparaginase (Y-axis) or the indicated compound (X-axis). Colors range between 0 and −200 according to the sensitivity in which −100% corresponds to proliferation arrest.

