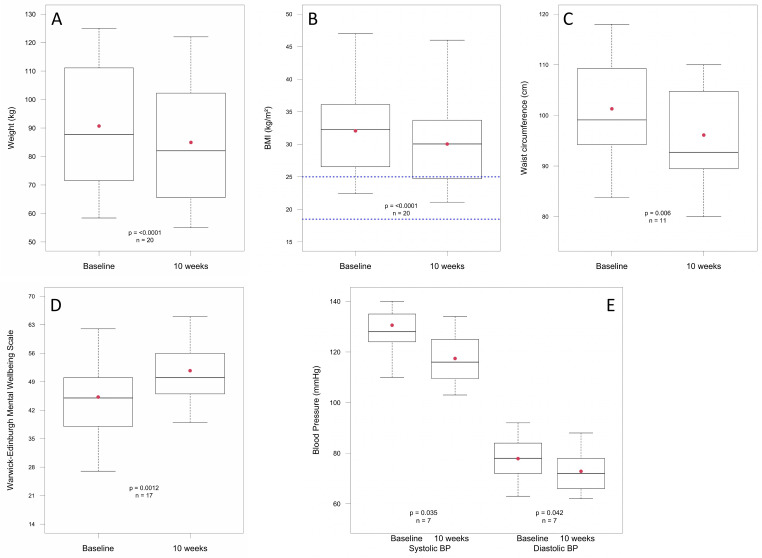
Figure 2.
Box and whisker charts showing baseline and 10-week distributions of patient data. The box represents the median value and the IQR, the red dot indicates the mean value and the upper and lower whiskers indicate either the minimum/maximum value or 1.5 times the IQR (outliers are not shown). Blue dotted line in figure part B denotes BMI range 18.5–25.0 kg/m2. BMI, body mass index.

