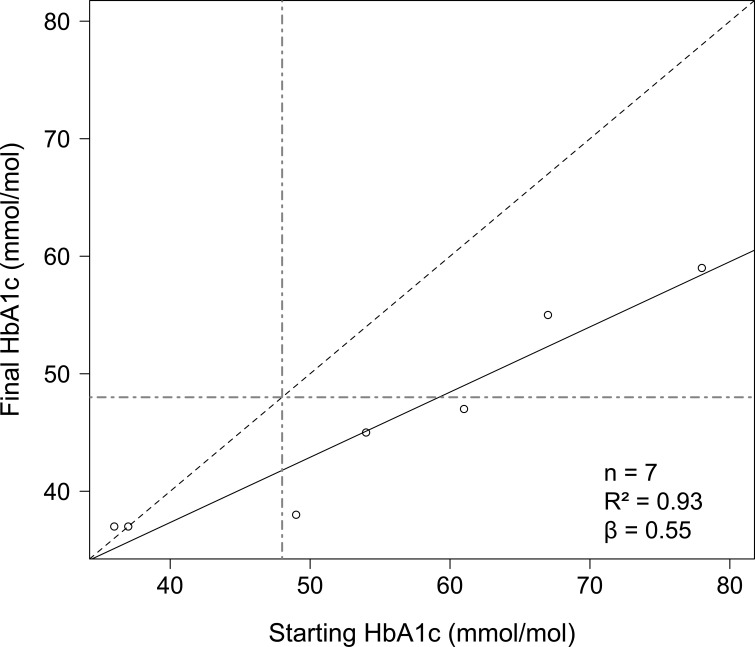
Figure 3.
Initial HbA1c versus HbA1c within 1 month of programme end. The blue dashed line represents no change in HbA1c. Points above this line represent participants with an increased HbA1c; points on this line represent those with no change; and points below this line represent participants with reductions in HbA1c. The black solid line is the line of best fit for linear regression of final HbA1c with respect to starting HbA1c. The green dot-dashed lines represent an HbA1c of 48 mmol/mol.

