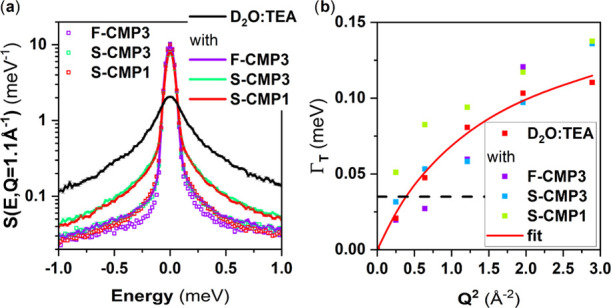
Figure 13.

(a) QENS spectra, at Q = 1.1 Å–1, of F-CMP3, S-CMP3, and S-CMP1, the mixture of solvents D2O:TEA and the CMPs mixed with D2O:TEA.. (b) HWHM of the Lorentzian representing the translational diffusion of the mixture of solvents D2O:TEA extracted from the fits as a function of Q2, with a jump diffusion fit (solid line). The horizontal dashed line represents the instrumental resolution.
