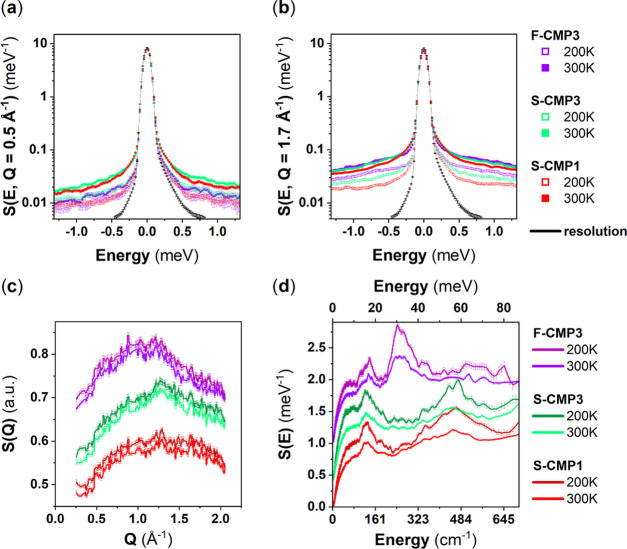
Figure 2.
Top: Q-dependent QENS spectra of dried F-CMP3, S-CMP3, and S-CMP1 at 200 and 300 K: (a) Q = 0.5 Å–1 and (b) Q = 1.7 Å–1. The instrumental resolution function of IN6 is measured by quenching S-CMP3 at 2 K and is represented by the narrow black solid elastic line. Bottom: (c) Neutron diffractograms of F-CMP3, S-CMP3, and S-CMP1, extracted from the same IN6 measurements at 200 and 300 K. (d) Generalized phonon density of states (GDOS) of F-CMP3, S-CMP3, and S-CMP1 at 200 and 300 K, also obtained from the same IN6 measurements.

