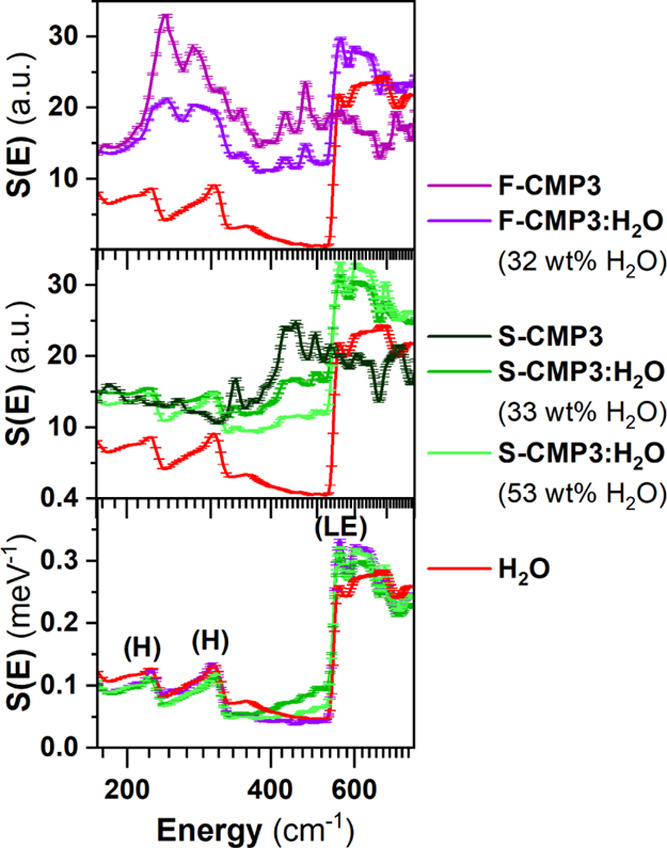
Figure 8.

GDOS spectra, from INS measurements at 10 K using IN1-Lagrange, of (top) F-CMP3 and (middle) S-CMP3 with H2O. (bottom) GDOS of bulk reference H2O and H2O in the F-CMP3 and S-CMP3, taken as the difference of the water-mixed CMPs (either F-CMP3:H2O or S-CMP3:H2O) and dried CMPs (either F-CMP3 or S-CMP3, respectively). The peaks labeled as (H) are assigned to the hydrogen-bond bending and stretching60 and as (LE) to refer to the librational edge.52,61
