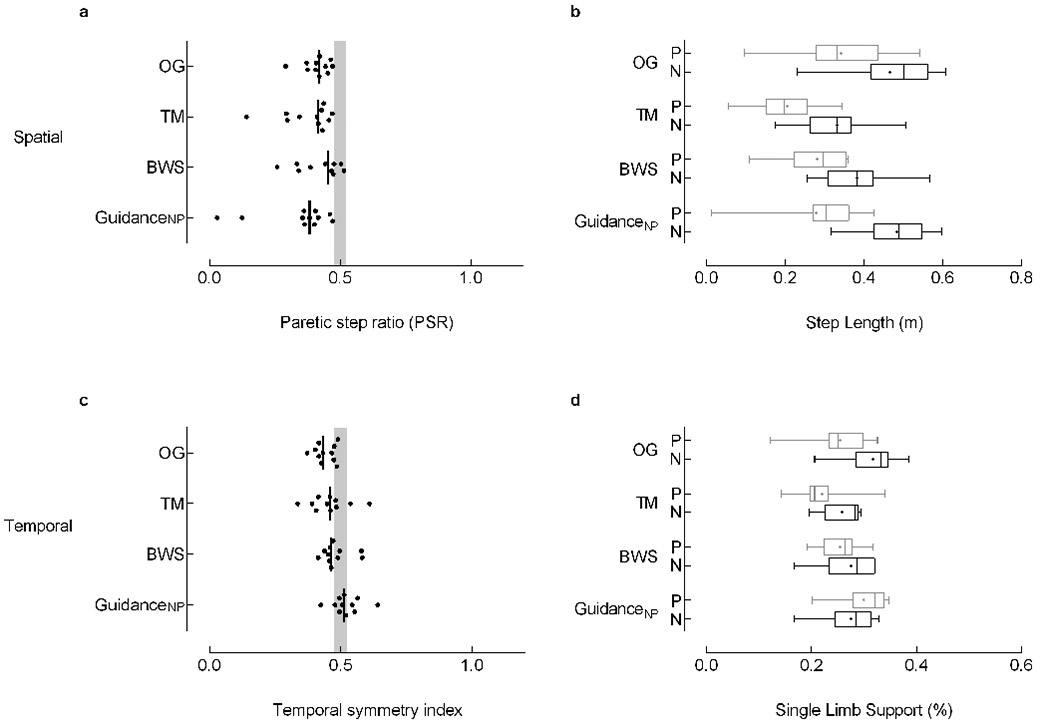
Figure 3. Paretic step length shorter than nonparetic (Pshort).

The Pshort group (n=11) was characterized by a shorter paretic step length than nonparetic step length while walking overground. Spatial (top, left) and temporal (bottom, left) symmetry were calculated with a symmetry index (SI) with the general equation SI =Xp/(Xp+Xnp), where Xp and Xnp are the paretic and nonparetic values for the variable of interest, respectively. Individual data are illustrated; the vertical black line represents the group median. The vertical gray shaded areas denote the SI values that represent symmetry (0.475 ≤ SI ≤ 0.525).7 Re-analysis of data without the extreme values noted in GuidanceNP condition of (a) do not influence symmetry findings or interpretation. Box-and-whisker plots for step length (top, right) and single limb support duration (SLS%; bottom, right) illustrate the distribution of the individual leg data. The whiskers illustrate the 5th and 95th percentiles. Group means are depicted with “+”. Paretic and nonparetic leg data are illustrated in grey and black, respectively. Note, a concurrent decrease in nonparetic SLS% (∆: 5%) and increase in paretic SLS% (∆: 5%) between the overground and GuidanceNP conditions (c). While these changes resulted in temporal symmetry, they failed to reach statistical significance. Abbreviations: OG: overground condition at self-selected walking speed; TM: treadmill condition at self-selected walking speed, with 0% BWS; BWS: body weight support condition at self-selected walking speed, with 30% BWS; GuidanceNP: fastest comfortable walking speed, with 30% BWS, and nonparetic limb guidance; P: paretic; N: nonparetic.
