
Fig 1.
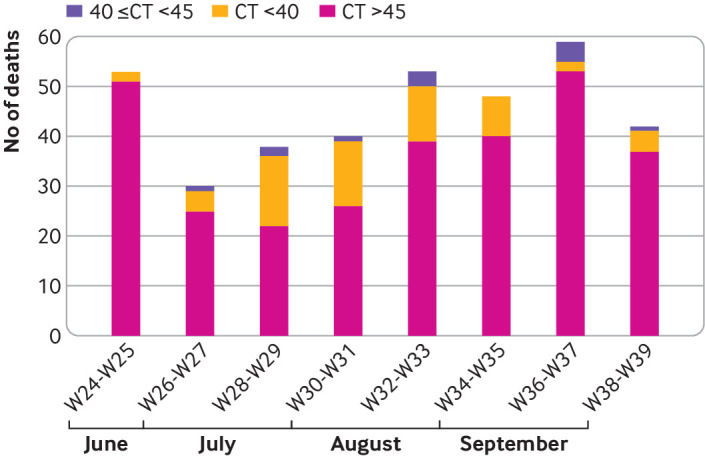
Biweekly detection of deaths with covid-19, June to September 2020. Cases positive for covid-19 are presented at two cycle thresholds: <40 (in yellow) and additional cases detected at cycle threshold (CT) value between 40 and 45 (in purple), against total deaths (in pink). For simplicity, these are presented with cases clustered in 2 week increments, from calendar weeks 24 through 39. Detection of covid-19 occurred throughout surveillance period, although with significant week to week variability. Owing to a high volume of deaths at the morgue, and the need to complete work on the ongoing postmortem infant study that continued through August 31, 2020, only a subset of deaths were enrolled on daily basis. In July, every fifth deceased person was enrolled, capping enrollments at around 5-6 participants per day; in August, this was reduced to every third person, with same daily cap; in September, when the full team could focus on covid-19 cases, it was expanded to 1:1 enrollment. For this reason, the total number of enrolled deaths in July and August represents only 10% of deaths that occurred during those periods. This has no bearing on the prevalence calculations but means that absolute number of deaths will be undercounted in this figure