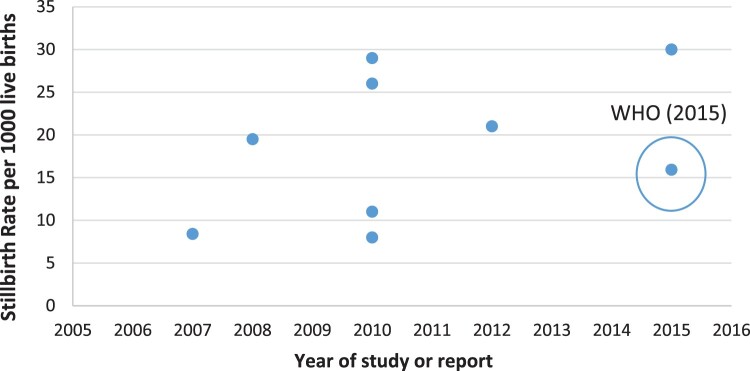
Figure 3.
Dispersion of stillbirth rates in PNG over time by different studies, and WHO reports
Notes: (1) Each point represents an estimate from a study, or UN report for PNG. All estimates are facility-based. (2) The 8.4 per 1000 live births for 2008 includes some data (combined) for 2007 and therefore is included as 2008.

