Fig. 3.
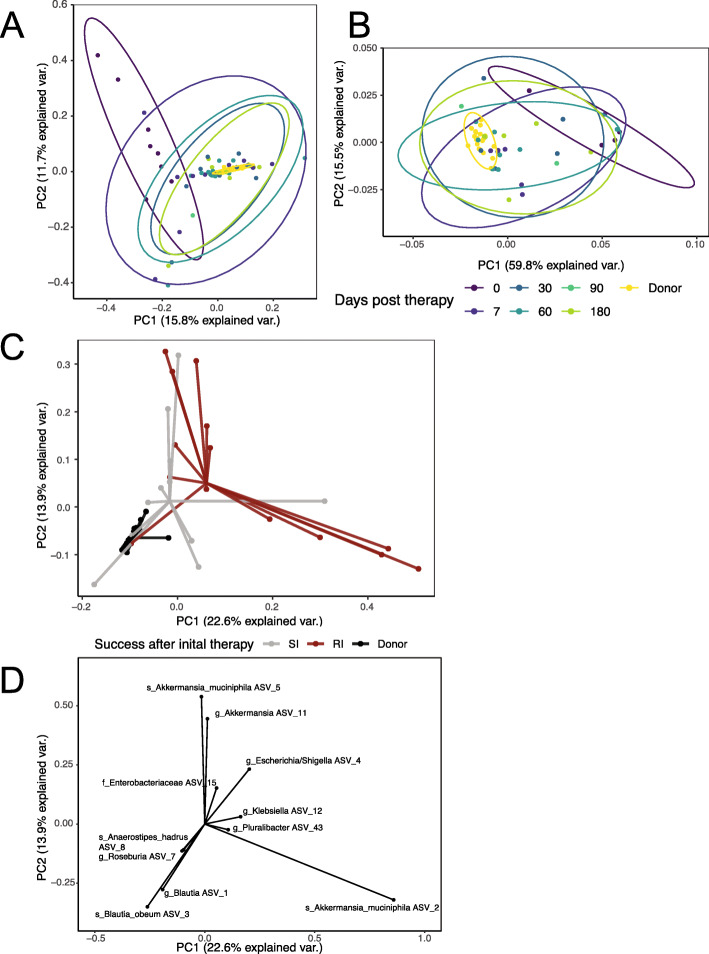
Taxonomy and microbial functional pathways converge after therapy receipt. a, b Principal component analysis (PCA) of patient microbiome taxonomic composition from 16S data (a) and of functional pathway abundances from whole metagenomic sequencing (b) in the SI group. Each colored dot represents an individual fecal sample after the first intervention with the circle representing 95% confidence interval with non-intersecting circles therefore statistically significant. Panel a shows 96 samples from all twelve patients with successful treatment and all four donors, while panel b shows 52 samples from eight successful patients and four donors (all of those who passed shotgun sequencing quality filters). c PCA from timepoint 7 samples after first study treatment only, colored by the SI or RI group (46 samples from all donors and all patients with day 7 samples; patient N = 25; donor N = 4). Each sample is connected to the centroid of its outcome group by a segment of the same color. d Taxonomy biplot shows the vectors of influence from taxa in distinguishing day 7 samples. The input samples, axes, and origin are the same as in c

