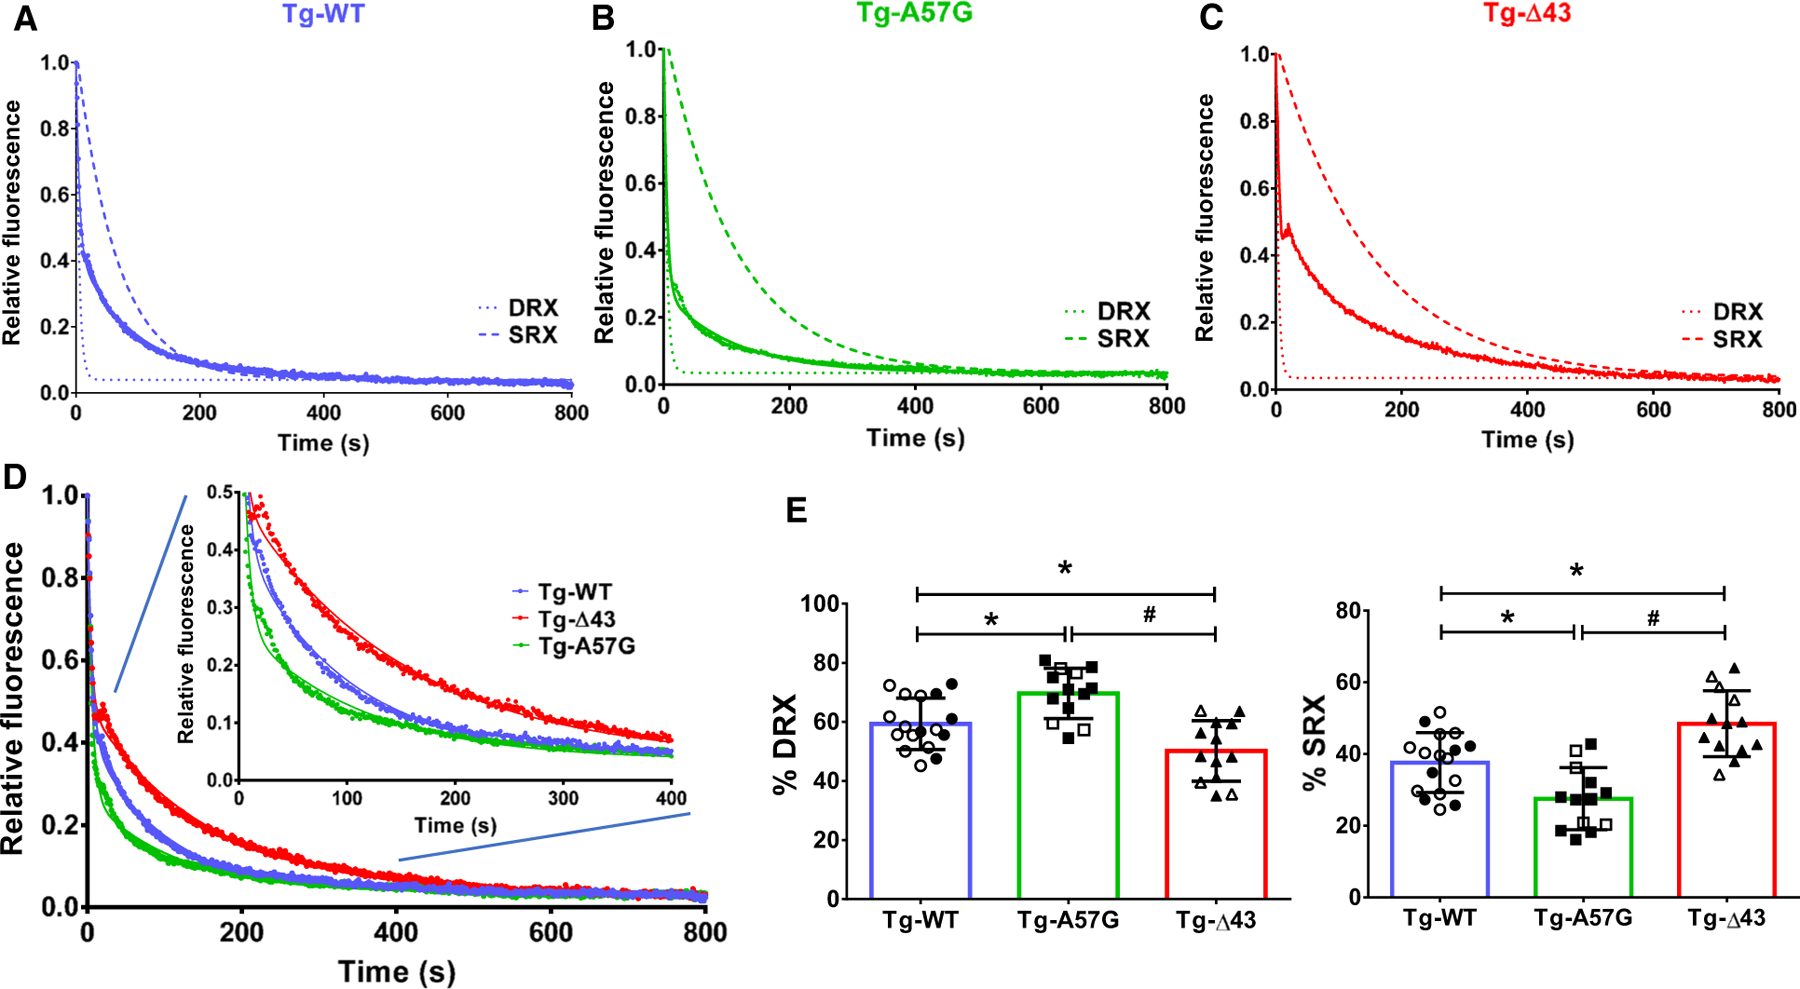
Fig. 1.

Single nucleotide turnover studies. Fluorescence decay curves of mantATP release in skinned papillary muscle (PM) fibers from: (A) Tg-WT (blue trace), n = 17 fibers, isolated from 5 female (F) and 3 male (M) mice; (B) Tg-A57G (green trace), n = 13 fibers (3F and 3M); and (C) Tg-Δ43 (red trace), n = 13 fibers (4F and 5M). PM were first incubated in 250 µm mantATP and subsequently chased with a solution containing 4 mm ATP. Decay traces were fitted to a double-exponential equation, yielding the fraction of myosin heads in DRX (P1) and SRX (P2) states, and respective lifetimes of fast (T1) and slow (T2) phases. Simulated single-exponential decays for DRX and SRX are depicted with dashed curves. (D) Overlapped fluorescence decay traces for Tg-WT, Tg-A57G, and Tg-Δ43 PM fibers. Inset depicts fluorescence decay traces collected from 0 to 400 s. (E) Proportion of myosin heads (in %) in DRX and SRX states for each group of mice. Open symbols depict PM fibers from F, while closed symbols depict PM fibers from M mice. Note that the % DRX is increased in Tg-A57G and decreased in Tg-Δ43. This is coupled to a decrease in % SRX in Tg-A57G and increase in Tg-Δ43. Data are mean T SD, in which n represents the number of fibers and *P < 0.05 depicts significance between Tg-WT and Tg-A57G/Tg-Δ43 and #P < 0.05 between Tg-A57G and Tg-Δ43, one-way ANOVA with Tukey’s multiple comparison test.
