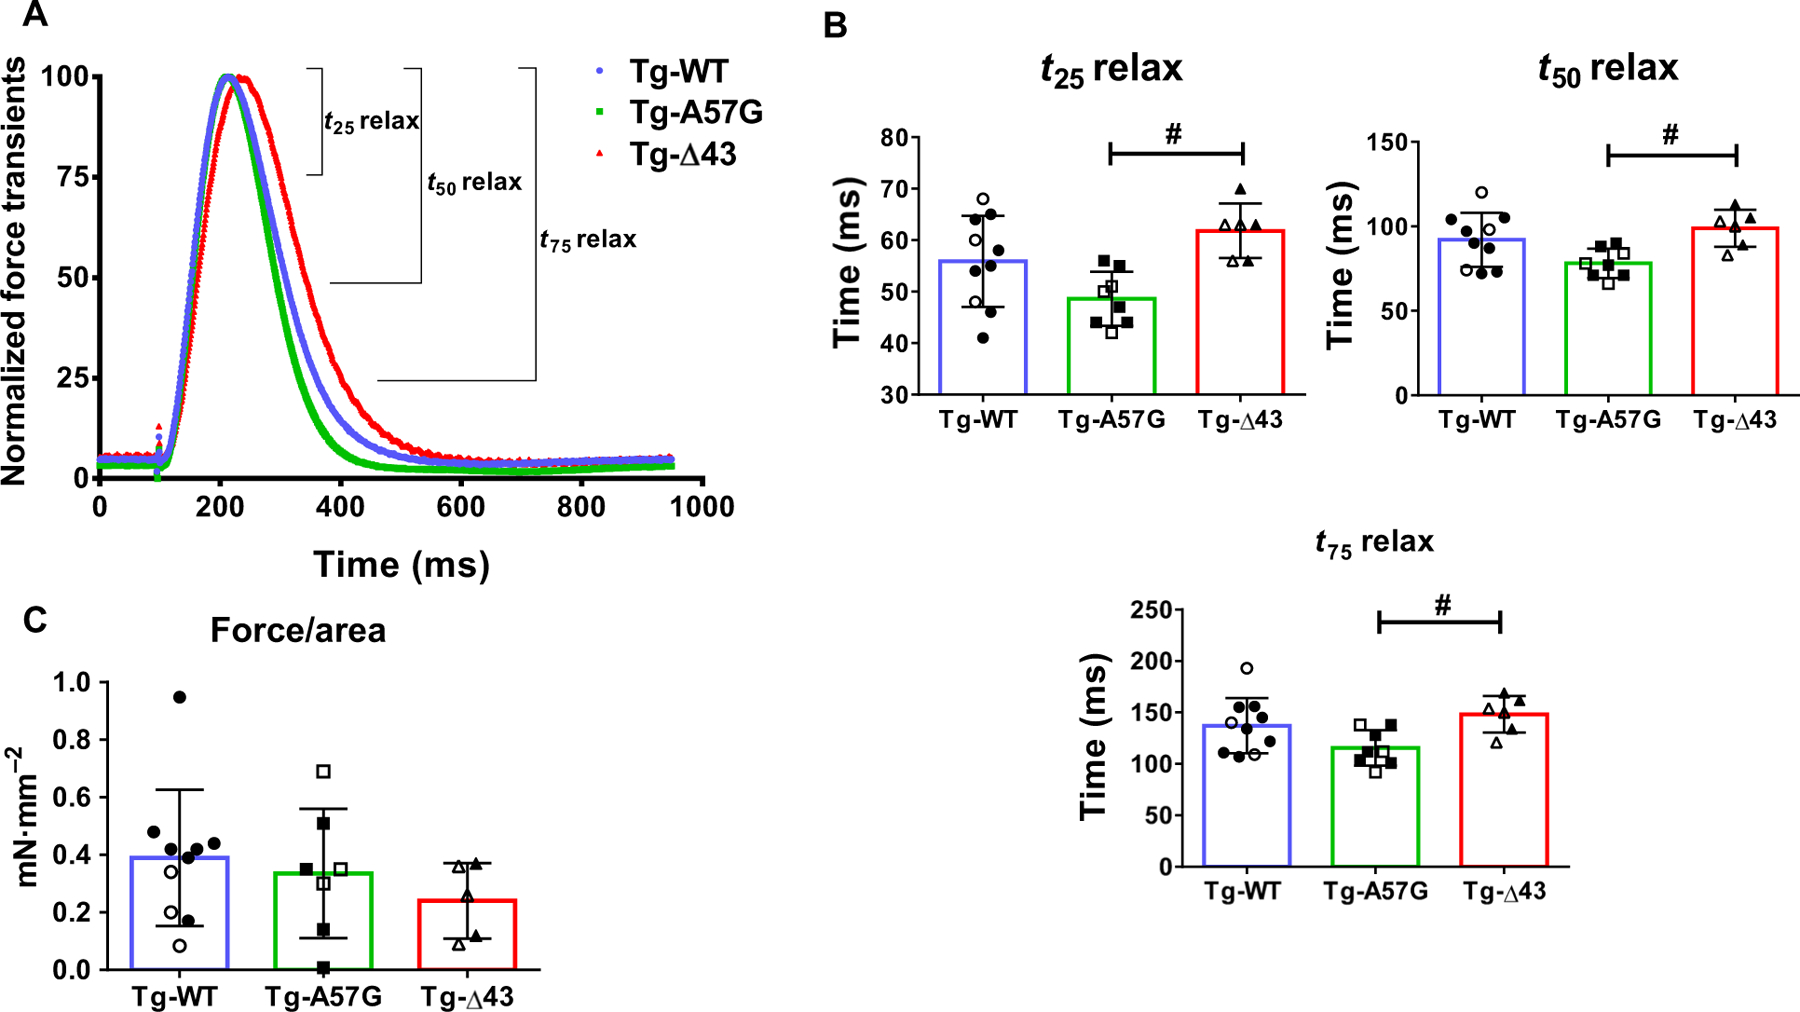
Fig. 3.

(A) Force transients in intact PM fibers from Tg-A57G and Tg-Δ43 compared with Tg-WT mice. Open symbols depict female (F), while closed symbols depict male (M) mice. (B) T25 relax, T50 relax, and T75 relax depict the time (in ms) from peak force to 25%, 50%, and 75% toward baseline. (C) Force (in mN·mm−2) was calculated as a ratio of peak force/physiologic cross-sectional area (see Materials and methods). Note faster relaxation times for Tg-A57G compared to Tg-Δ43 mice. Values are mean of n = 8 (3F and 5M) Tg-A57G, n = 6 (3F and 3M) Tg-Δ43, and n = 10 (3F and 7M) Tg-WT animals ± SD with #P < 0.05 depicting significance between Tg-A57G and Tg-Δ43, calculated by one-way ANOVA with Tukey’s multiple comparison test.
