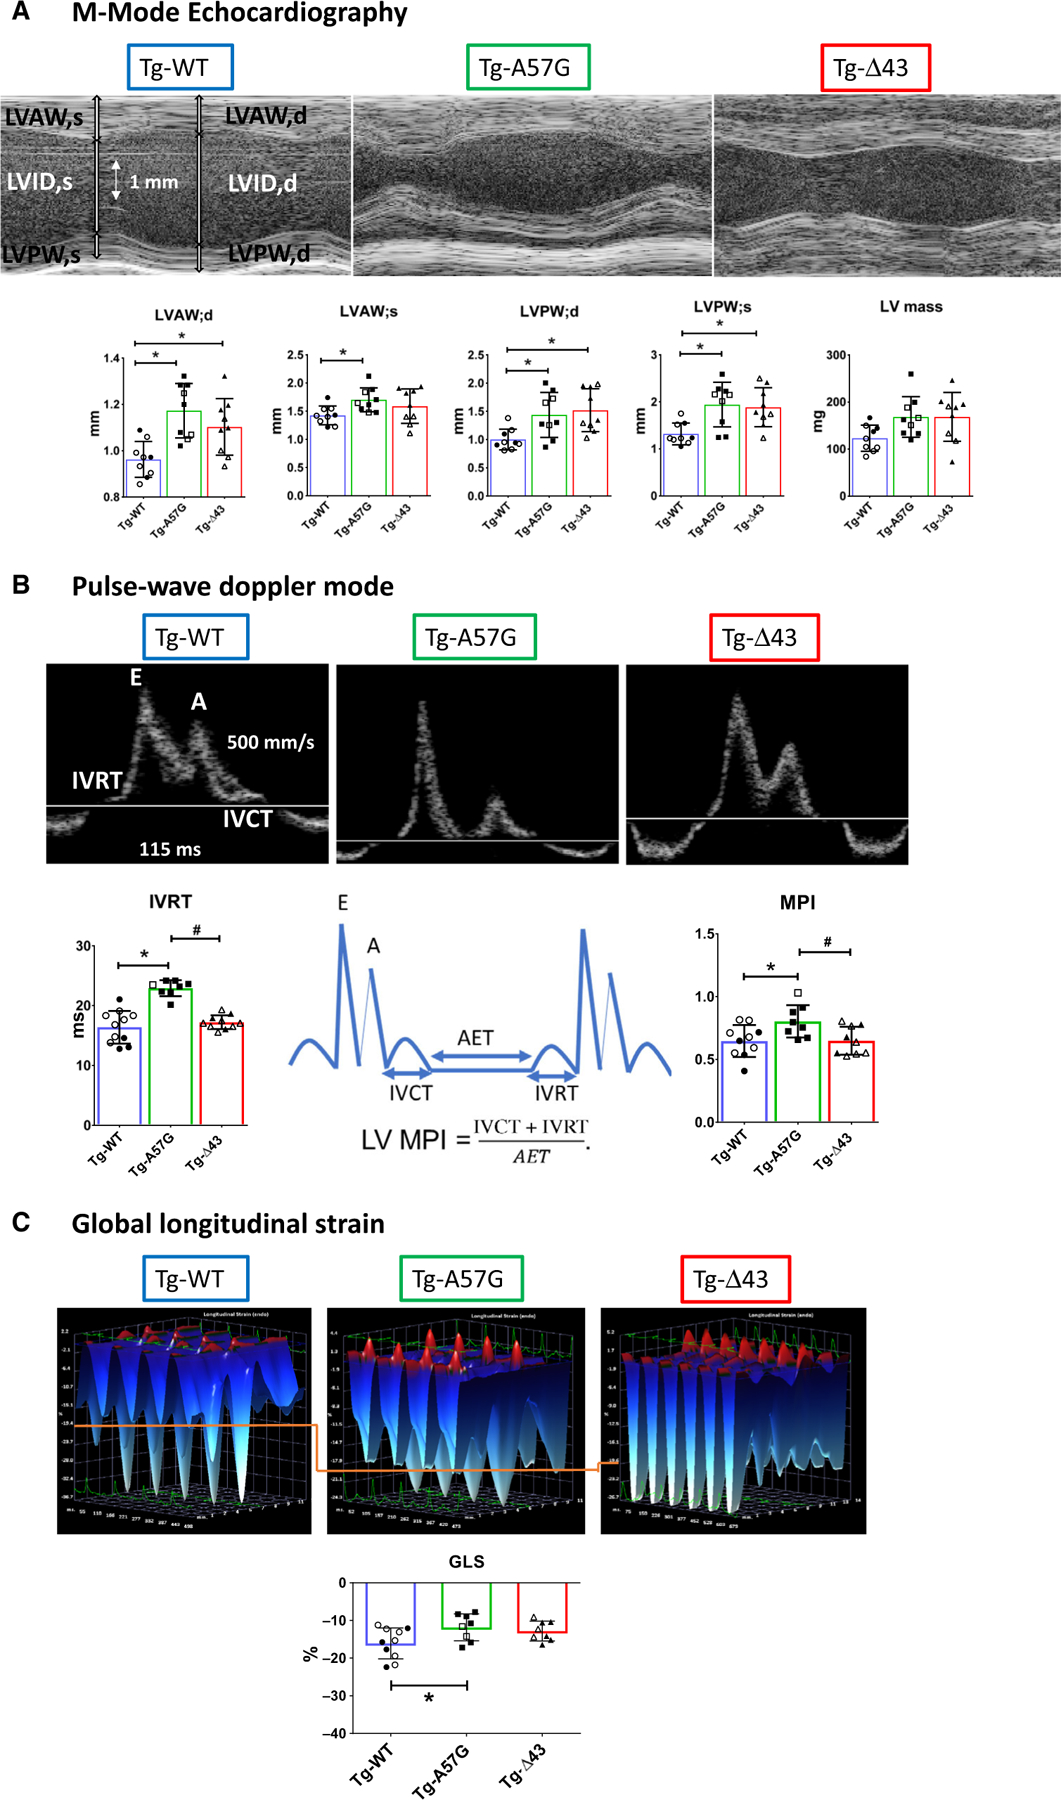
Fig. 5.

Echocardiography measurements in Tg-WT, Tg-A57G, and Tg-Δ43 mice. (A) Upper panel: Representative echocardiographic images of mouse hearts in M-mode. Lower panel: The assessment of heart morphology and function in Tg-A57G (n = 9 mice) and Tg-Δ43 (n = 9 mice) compared to Tg-WT (n = 9 mice). Open symbols depict F, while closed symbols depict M mice. Note increased wall thickness in Tg-A57G and Tg-Δ43 compared to Tg-WT. LVAW;d/s, left ventricular anterior wall thickness in diastole/systole; LVPW, LV posterior wall thickness. (B) Upper panel: Representative pulse-wave and tissue Doppler images of transgenic hearts. Lower panel: Assessment of IVRT (isovolumetric relaxation time) and MPI (myocardial performance index) in mice. Note increased IVRT and MPI in Tg-A57G compared to Tg-WT and Tg-Δ43. (C) Upper panel: Representative three-dimensional longitudinal strain deformation images for Tg-WT, Tg-A57G, and Tg-Δ43 hearts showing contraction (red, positive) and relaxation (blue, negative) over six LV segments during four consecutive cardiac cycles. The orange line has been added to aid comparison of the images’ scale. Lower panel: Speckle tracking-based strain analysis (Global longitudinal strain) on Tg-WT, Tg-A57G, and Tg-Δ43. Lower (less negative values) in Tg-A57G versus Tg-WT, indicative of poorer global cardiac function in HCM Tg-A57G mouse model. Data are mean of n = 9 animals/per group T SD with *P < 0.05 depicting significance between Tg-WT and Tg-A57G and #P < 0.05 between Tg-A57G and Tg-Δ43, one-way ANOVA with Tukey’s multiple comparison test.
