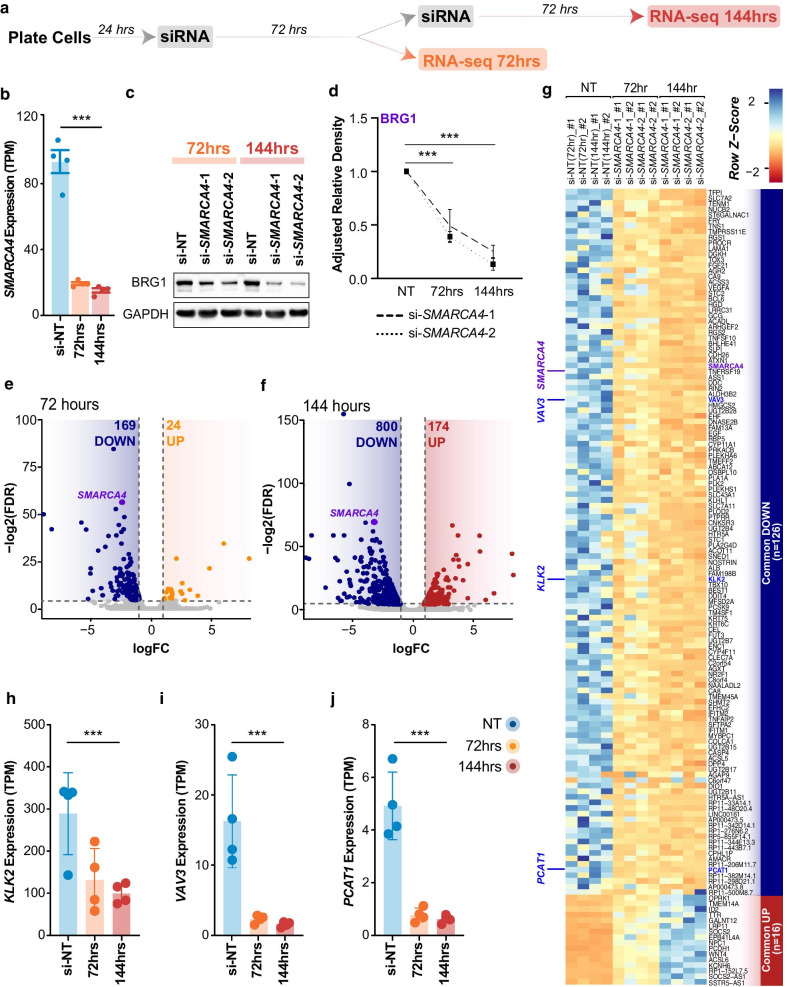
Fig. 2.
Loss of BRG1 results in a down-regulation of gene expression. a Schematic of temporal BRG1 knockdown model used for RNA-seq. Samples were collected at 72hrs (si-NT control, si-SMARCA4-1 and si-SMARCA4-2) and 144hrs (si-NT, si-SMARCA4-1 and si-SMARCA4-2) post-siRNA transfection in duplicate for each condition at each time point (n = 2). Cells were transfected with either control siRNA (si-NT) or SMARCA4 siRNA. b SMARCA4 gene expression in control and post BRG1 depletion in the RNA-seq data, shown as transcripts per million reads (TPM). Control siRNA for 72 and 144 h is shown collectively as si-NT. SMARCA4 expression is significantly down-regulated at both time points, ***p < 0.0001. Bars denote mean, and error bars are SD. c Representative Western blots of BRG1 and GAPDH protein levels at 72 and 144 h post-transfection. d Adjusted relative density for BRG1 is calculated relative to GAPDH and normalised to the non-targeting control. Points denote mean, and error bars are SD. e, f Volcano plots of differentially expressed genes at 72 h and 144 h post-knockdown. Significantly down-regulated genes are blue and significantly up-regulated genes for 72 and 144 h post-knockdown are shown in orange and red, respectively. SMARCA4 differential expression is highlighted in purple. Expression is shown as normalised log2 counts per million reads. g Heatmap illustrating RNA-seq differential gene expression data for up (n = 16) and down (n = 126) regulated genes common to both time points after BRG1 depletion. Expression is represented as the normalised row Z-score of TPM. h, i, j KLK2, VAV3 and PCAT-1 gene expression from the RNA-seq datasets shown as TPM. Bars denote mean, and error bars are SD

