Fig. 5.
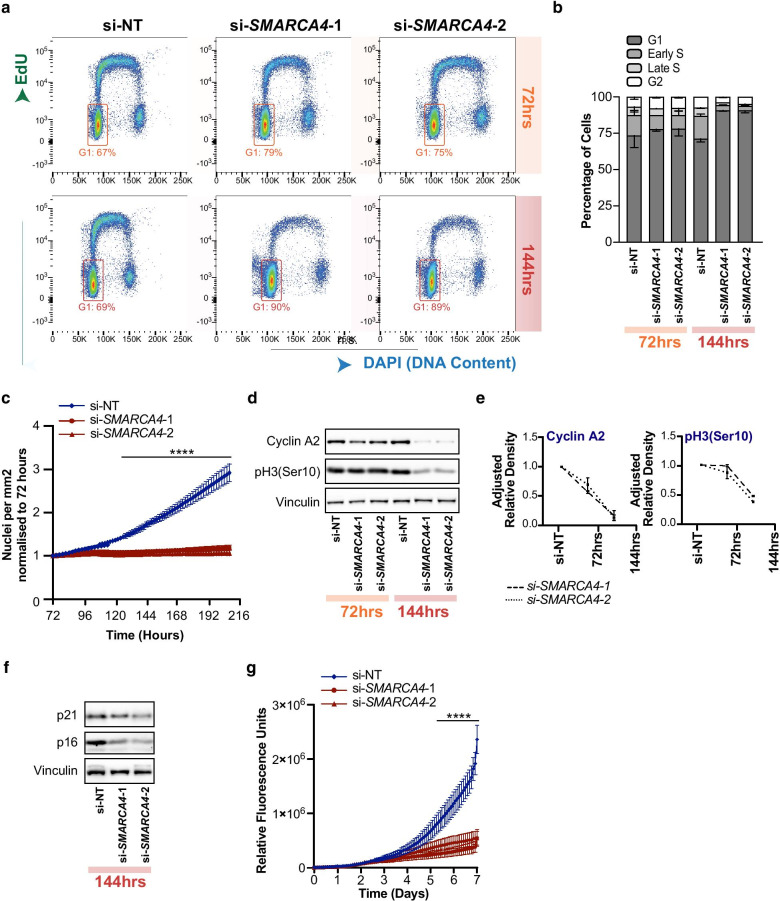
BRG1 depletion reduced proliferation. a Representative flow cytometry scatter of DAPI (x-axis) and EdU (y-axis) fluorescence intensity at 72 and 144 h post BRG1 knockdown. G1 cells are shown by boxed gate. b Percentage of cells in each phase of the cell cycle from flow cytometry data, error bars show standard deviation (n = 2). Error bars show SD. c Fold change of nuclei count per mm2 from 72 to 216 h after BRG1 knockdown, normalised to 72 h (n = 3). A significant difference was identified from 128 h until the end of the time course. Significance was determined by one-way ANOVA, with Dunnett’s multiple correction where **** = p < 0.0001 for si-NT versus si-SMARCA4-1 and si-NT versus si-SMARCA4-2. d Representative Western blot showing protein levels of mitosis markers Cyclin A2 and pH3 (Ser10) 72 and 144 h post BRG1 depletion. e Quantification of Western blots demonstrating adjusted relative density to Vinculin (n = 3). Error bars are SD. f Representative Western blot of senescence markers p21 and p16 at 144 h post BRG1 depletion (n = 3). g Relative fluorescence units of caspase-3 activity determined from live-cell imaging over the course of 7 days from siRNA transfection. A significant difference was detected between the si-NT cells and BRG1 depleted cells from 128 h until the end of the time course. Significance was determined by one-way ANOVA, with Dunnett’s multiple correction where **** = p < 0.001 for si-NT versus si-SMARCA4-1 and si-NT versus si-SMARCA4-2

