Figure 1.
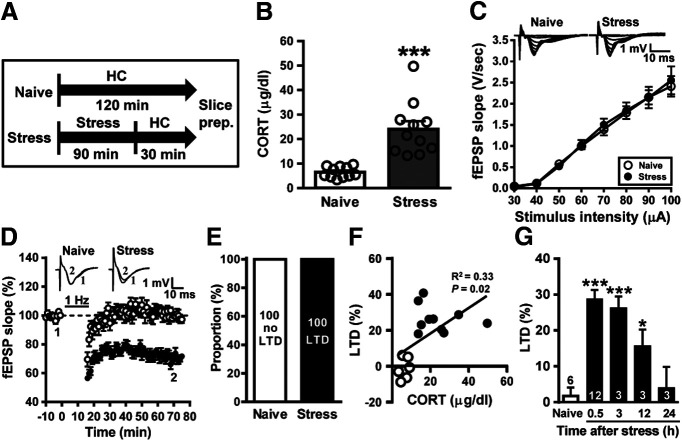
Acute stress facilitates the induction of LTD in the CA1 region of the hippocampus. A, Schematic showing the experimental design and timeline. Naive mice remained in the home cage (HC) for 120 min. The stressed mice were exposed to an inescapable restraint–tailshock stress for 60 min, and then were kept alone in their home cage for 30 min before slice preparation. B, Bar graph comparing serum corticosterone levels in naive male mice and stressed male mice. C, Input–output curve of fEPSP (V/s) versus stimulus intensity (µA) at Schaffer collateral–CA1 synapses in slices from naive and stressed male mice. D, Summary of experiments showing the induction of hippocampal CA1 LTD by a prolonged LFS (1 Hz for 15 min) at Schaffer collateral–CA1 synapses in slices from naive and stressed male mice. E, Bar graph illustrating the proportion of individuals that express LTD or no LTD in naive and stressed groups. F, A significant positive linear correlation is evident between the serum corticosterone levels and LTD expression. G, Bar graphs comparing the average magnitudes of LTD in slices from naive and stressed male mice at different time points (0.5–24 h) after the termination of stress. The magnitudes of LTD were measured at 50–60 min after LFS. Representative traces of fEPSPs were taken at the time indicated by number. Dash lines show the level of baseline. Data represent the mean ± SEM. Numbers in parentheses represent animals examined. *p < 0.05 and *** p < 0.001 compared with naive mice by two-tailed unpaired Student's t test or Bonferroni's post hoc test.

