Figure 3.

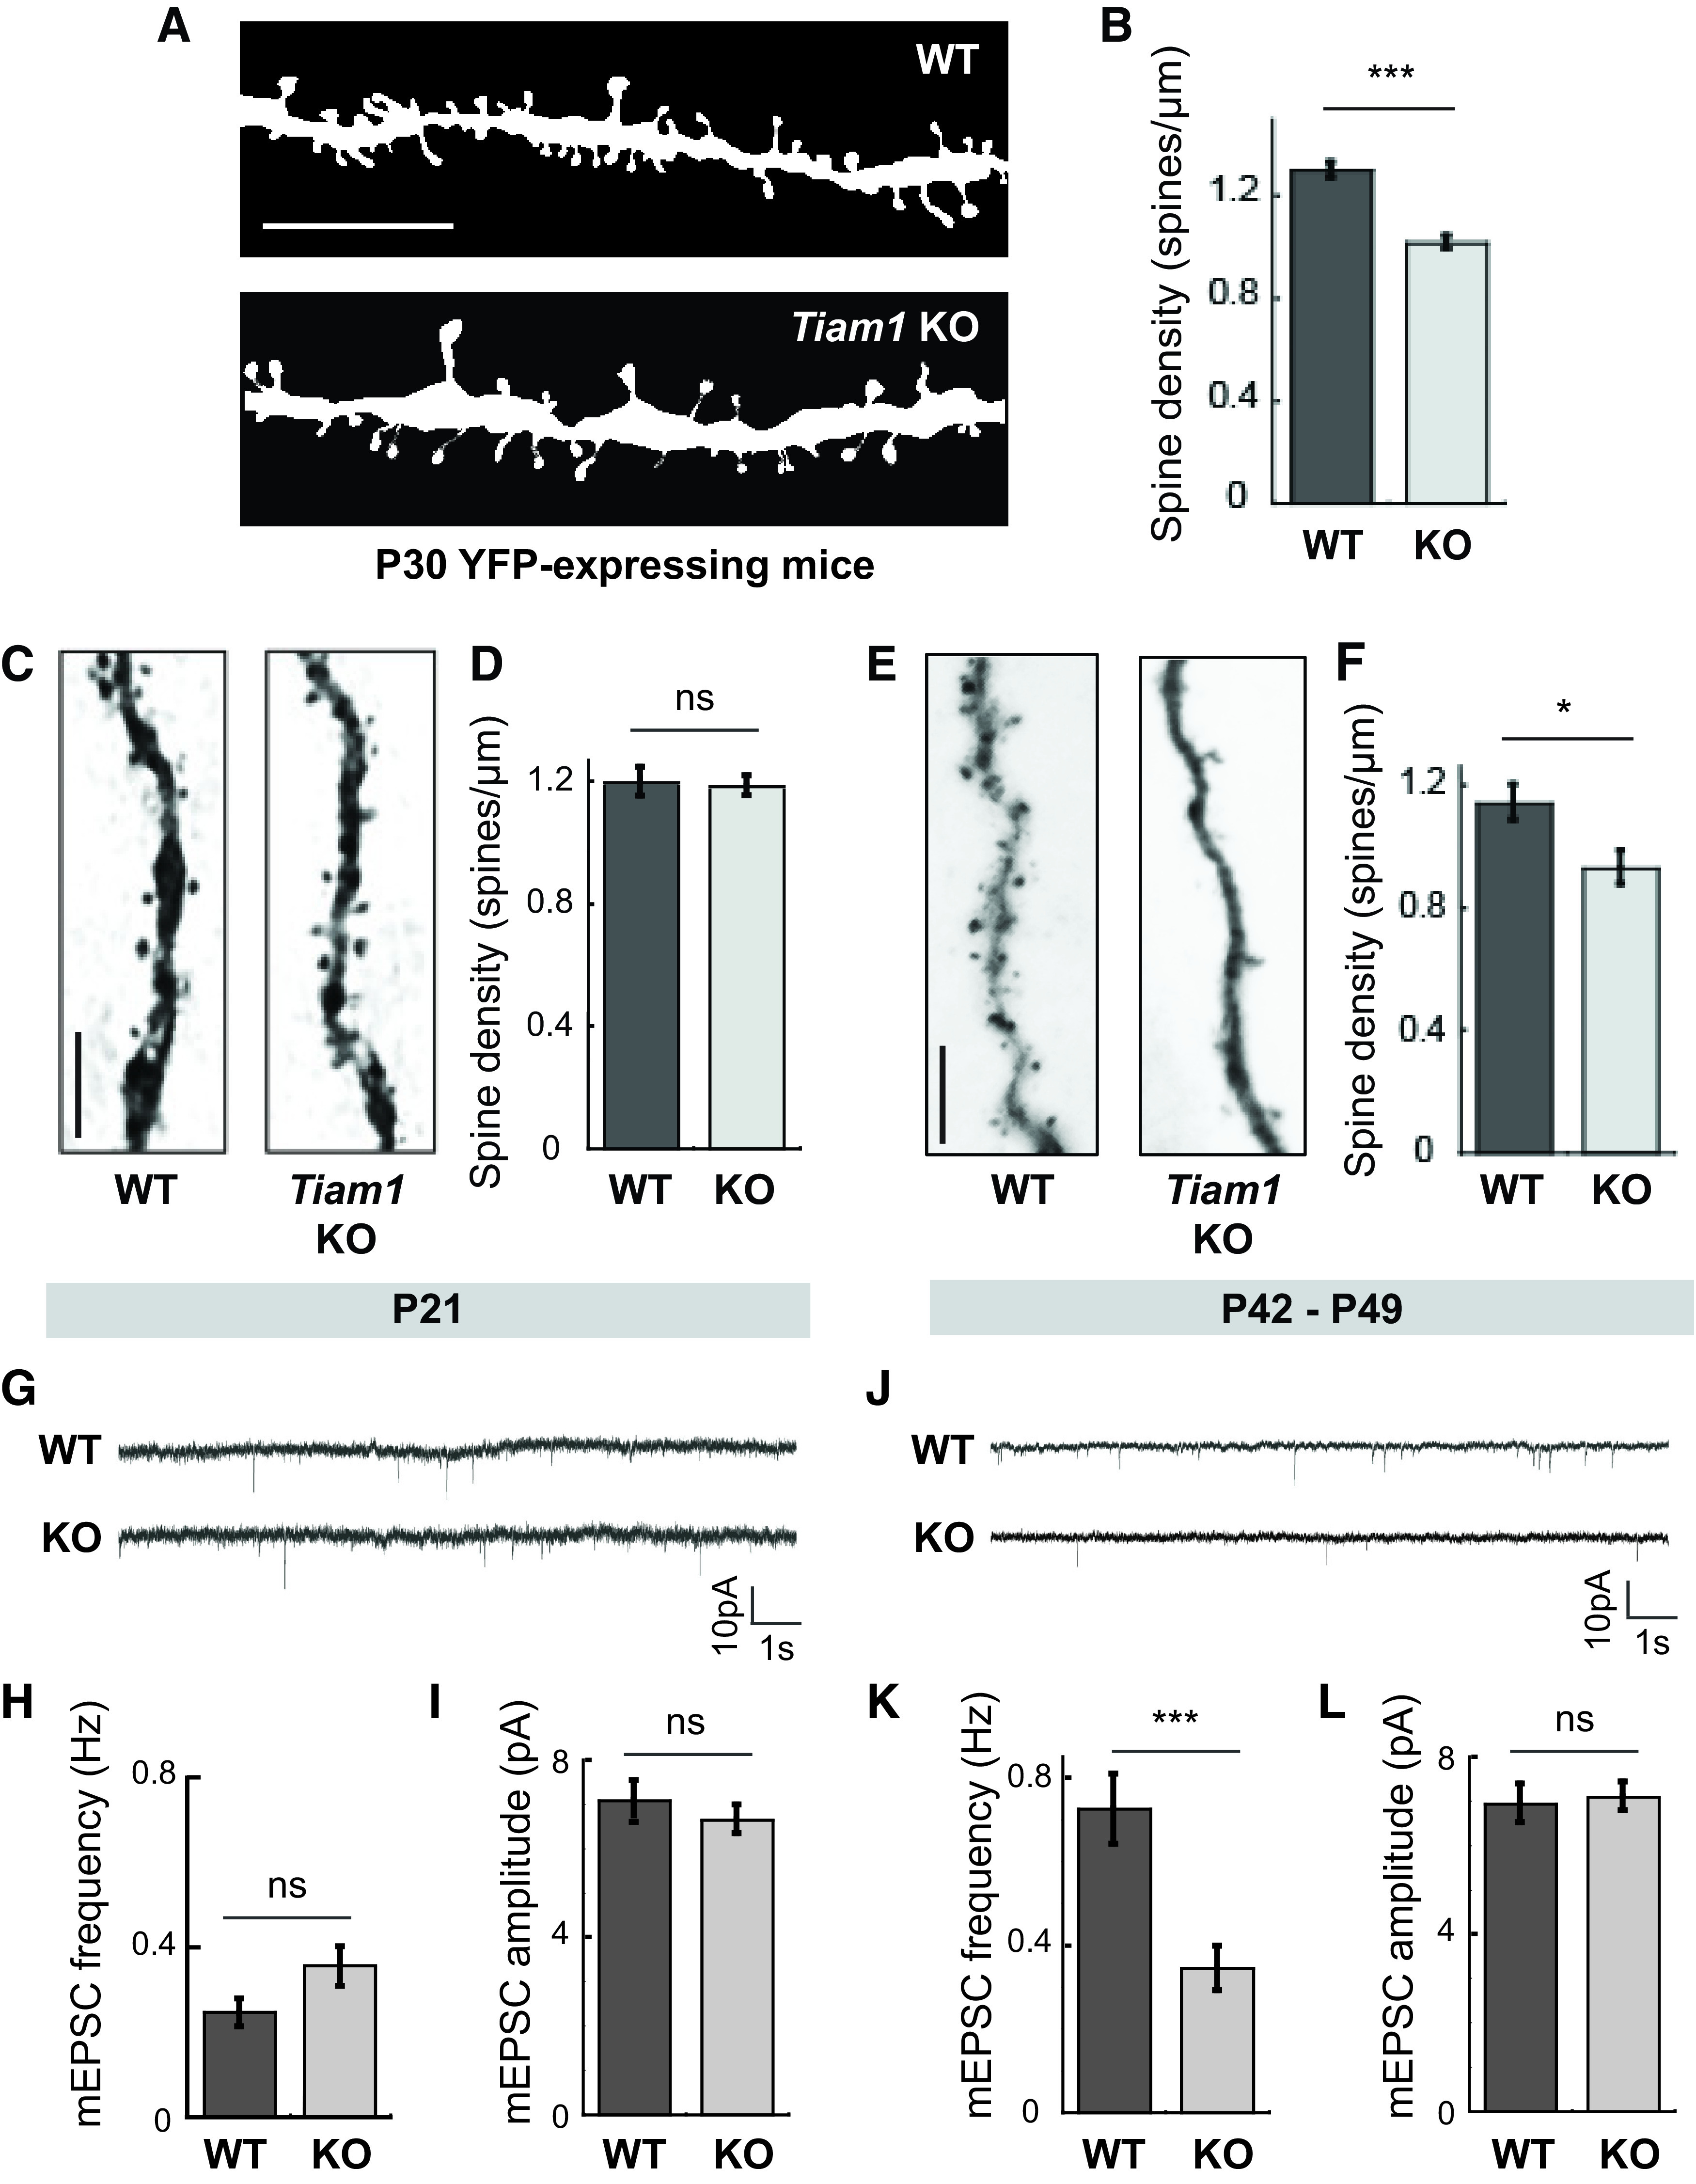
Tiam1 is essential for DG granule cell dendritic spine and excitatory synapse maintenance. A, Representative images of spines on DG granule cells from YFP-expressing 1-month-old WT and Tiam1 KO mice. Scale bar, 5 µm. B, Quantification of spine density of YFP-expressing DG granule cells from A, showing reduced spine density on DG granule cells from Tiam1 KO mice (t(235) = 7.5827, p < 0.0001, unpaired t test, WT, n = 117 neurons, N = 3 mice; Tiam1 KO, n = 120 neurons, N = 3 mice). C, Representative images of spines from biocytin-filled DG granule cells from P21 WT and Tiam1 KO mice. Scale bar, 5 µm. D, Quantification of spine density of biocytin-filled DG granule cells in C, showing similar spine densities in WT and Tiam1 KO mice at P21 (t(23) = 0.068, p = 0.946, unpaired t test, WT, n = 13 neurons, N = 3 mice; Tiam1 KO, n = 12 neurons, N = 3 mice). E, Representative images of spines from biocytin-filled DG granule cells from P42–P49 WT and Tiam1 KO mice. Scale bar, 5 µm. F, Quantification of spine density of biocytin-filled DG granule cells in E, confirming reduced spine density on DG granule cells from P42–P49 Tiam1 KO mice (t(39) = 2.627, p = 0.0123, unpaired t test, WT, n = 23 neurons, N = 3 mice; Tiam1 KO, n = 17 neurons, N = 3 mice). G–I, Representative traces (G) and summary graphs (H,I) of mEPSCs recorded from DG granule cells from P21 WT and Tiam1 KO mice showing similar excitatory synaptic transmission (frequency: t(41) = 1.841, p = 0.073, unpaired t test; amplitude: t(41) = 0.972, p = 0.337, unpaired t test, WT, n = 21 neurons, N = 3 mice; Tiam1 KO, n = 22 neurons, N = 3 mice). J–L, Representative traces (J) and summary graphs (K,L) of mEPSCs recorded from DG granule cells from P42–P49 WT and Tiam1 KO mice showing decreased mEPSC frequency for Tiam1 KO DG granule cells relative to WT DG granule cells at later developmental stages (frequency: t(56) = 3.710, p = 0.00048, unpaired t test; amplitude: t(56) = 0.283, p = 0.778, unpaired t test, WT, n = 31 neurons, N = 3 mice; Tiam1 KO, n = 37 neuron, N = 3 mice). Data are mean ± SEM. *p < 0.05. **p < 0.01. ***p < 0.001. Not significant (ns), p > 0.05.
