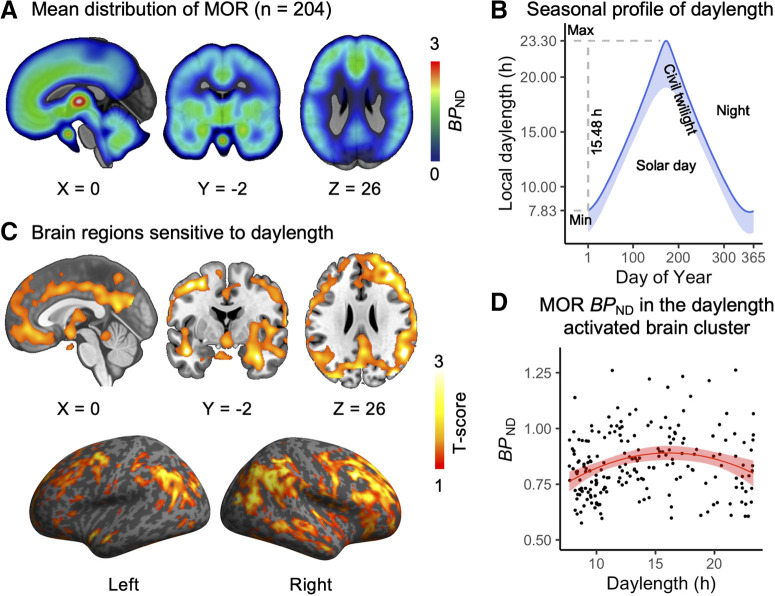
Figure 2.
Human brain MOR availability and natural variation in daylength. A, Mean distribution of MOR availability in the subjects. B, Local seasonal distribution of daylength (day + civil twilight). C, The brain cluster sensitive to the seasonal daylength changes in quadratic polynomial regression model. p < 0.05, FDR corrected. D, [11C]carfentanil BPND in the brain cluster as a function of daylength. Red line shows polynomial LS (least-squares) regression curve (y ∼ x + x2) predicting BPND, and shaded area shows 95% CI.

