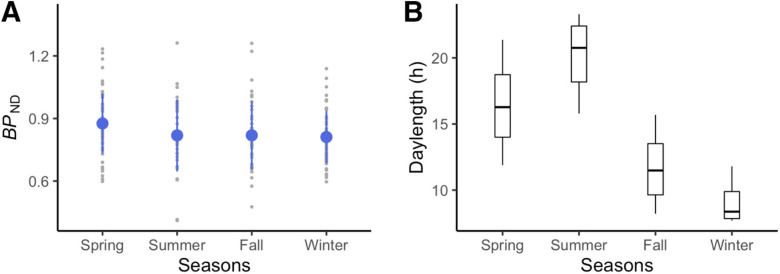
Figure 3.
Visualization of season-dependent MOR availability as a function of meteorological seasons in humans. A, Mean BPND in the cluster showing daylength-dependent variability in the full-volume analysis. Blue dots stand for means, and error bars stand for standard deviations. B, Local daylength as a function of meteorological seasons.

