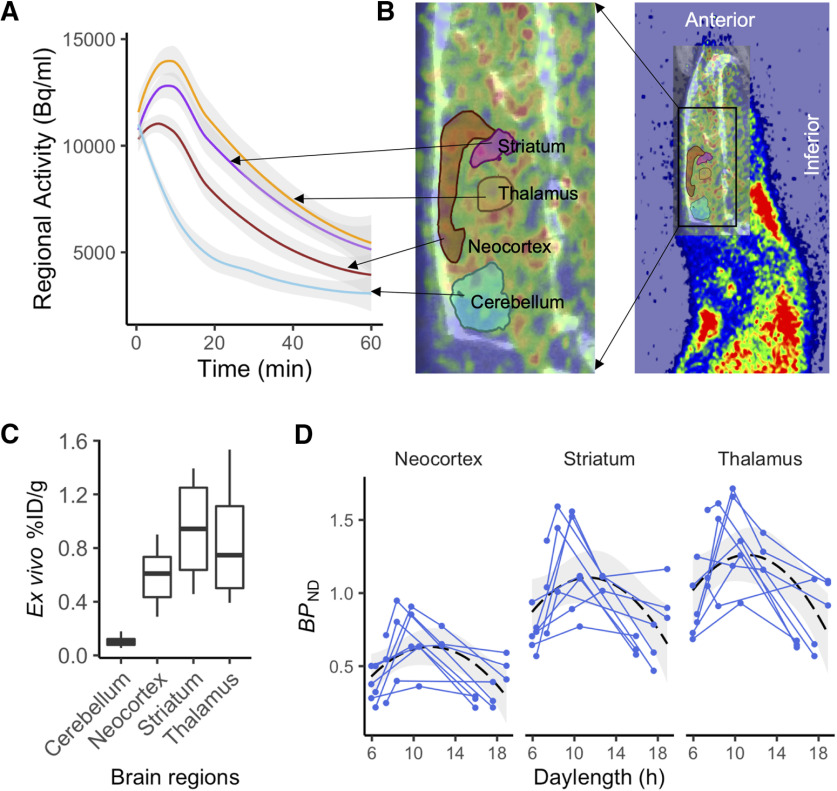
Figure 4.
Within-animal changes in brain MOR availability as a function of daylength. A, B, Mean (with shaded area for 95% CI) time–activity curves for the reference region and the target regions (A) extracted using ROI template image overlaid on the PET and CT images (B). C, Ex vivo biodistribution of [11C]carfentanil in brain regions of interests. D, Individual animals are shown as separate lines. Black dashed line shows the least-squares (LS) regression curve for the polynomial model (y ∼ x + x2) predicting BPND across the whole sample. Shaded area shows the 95% CI for the LS curve.

