Figure 2.

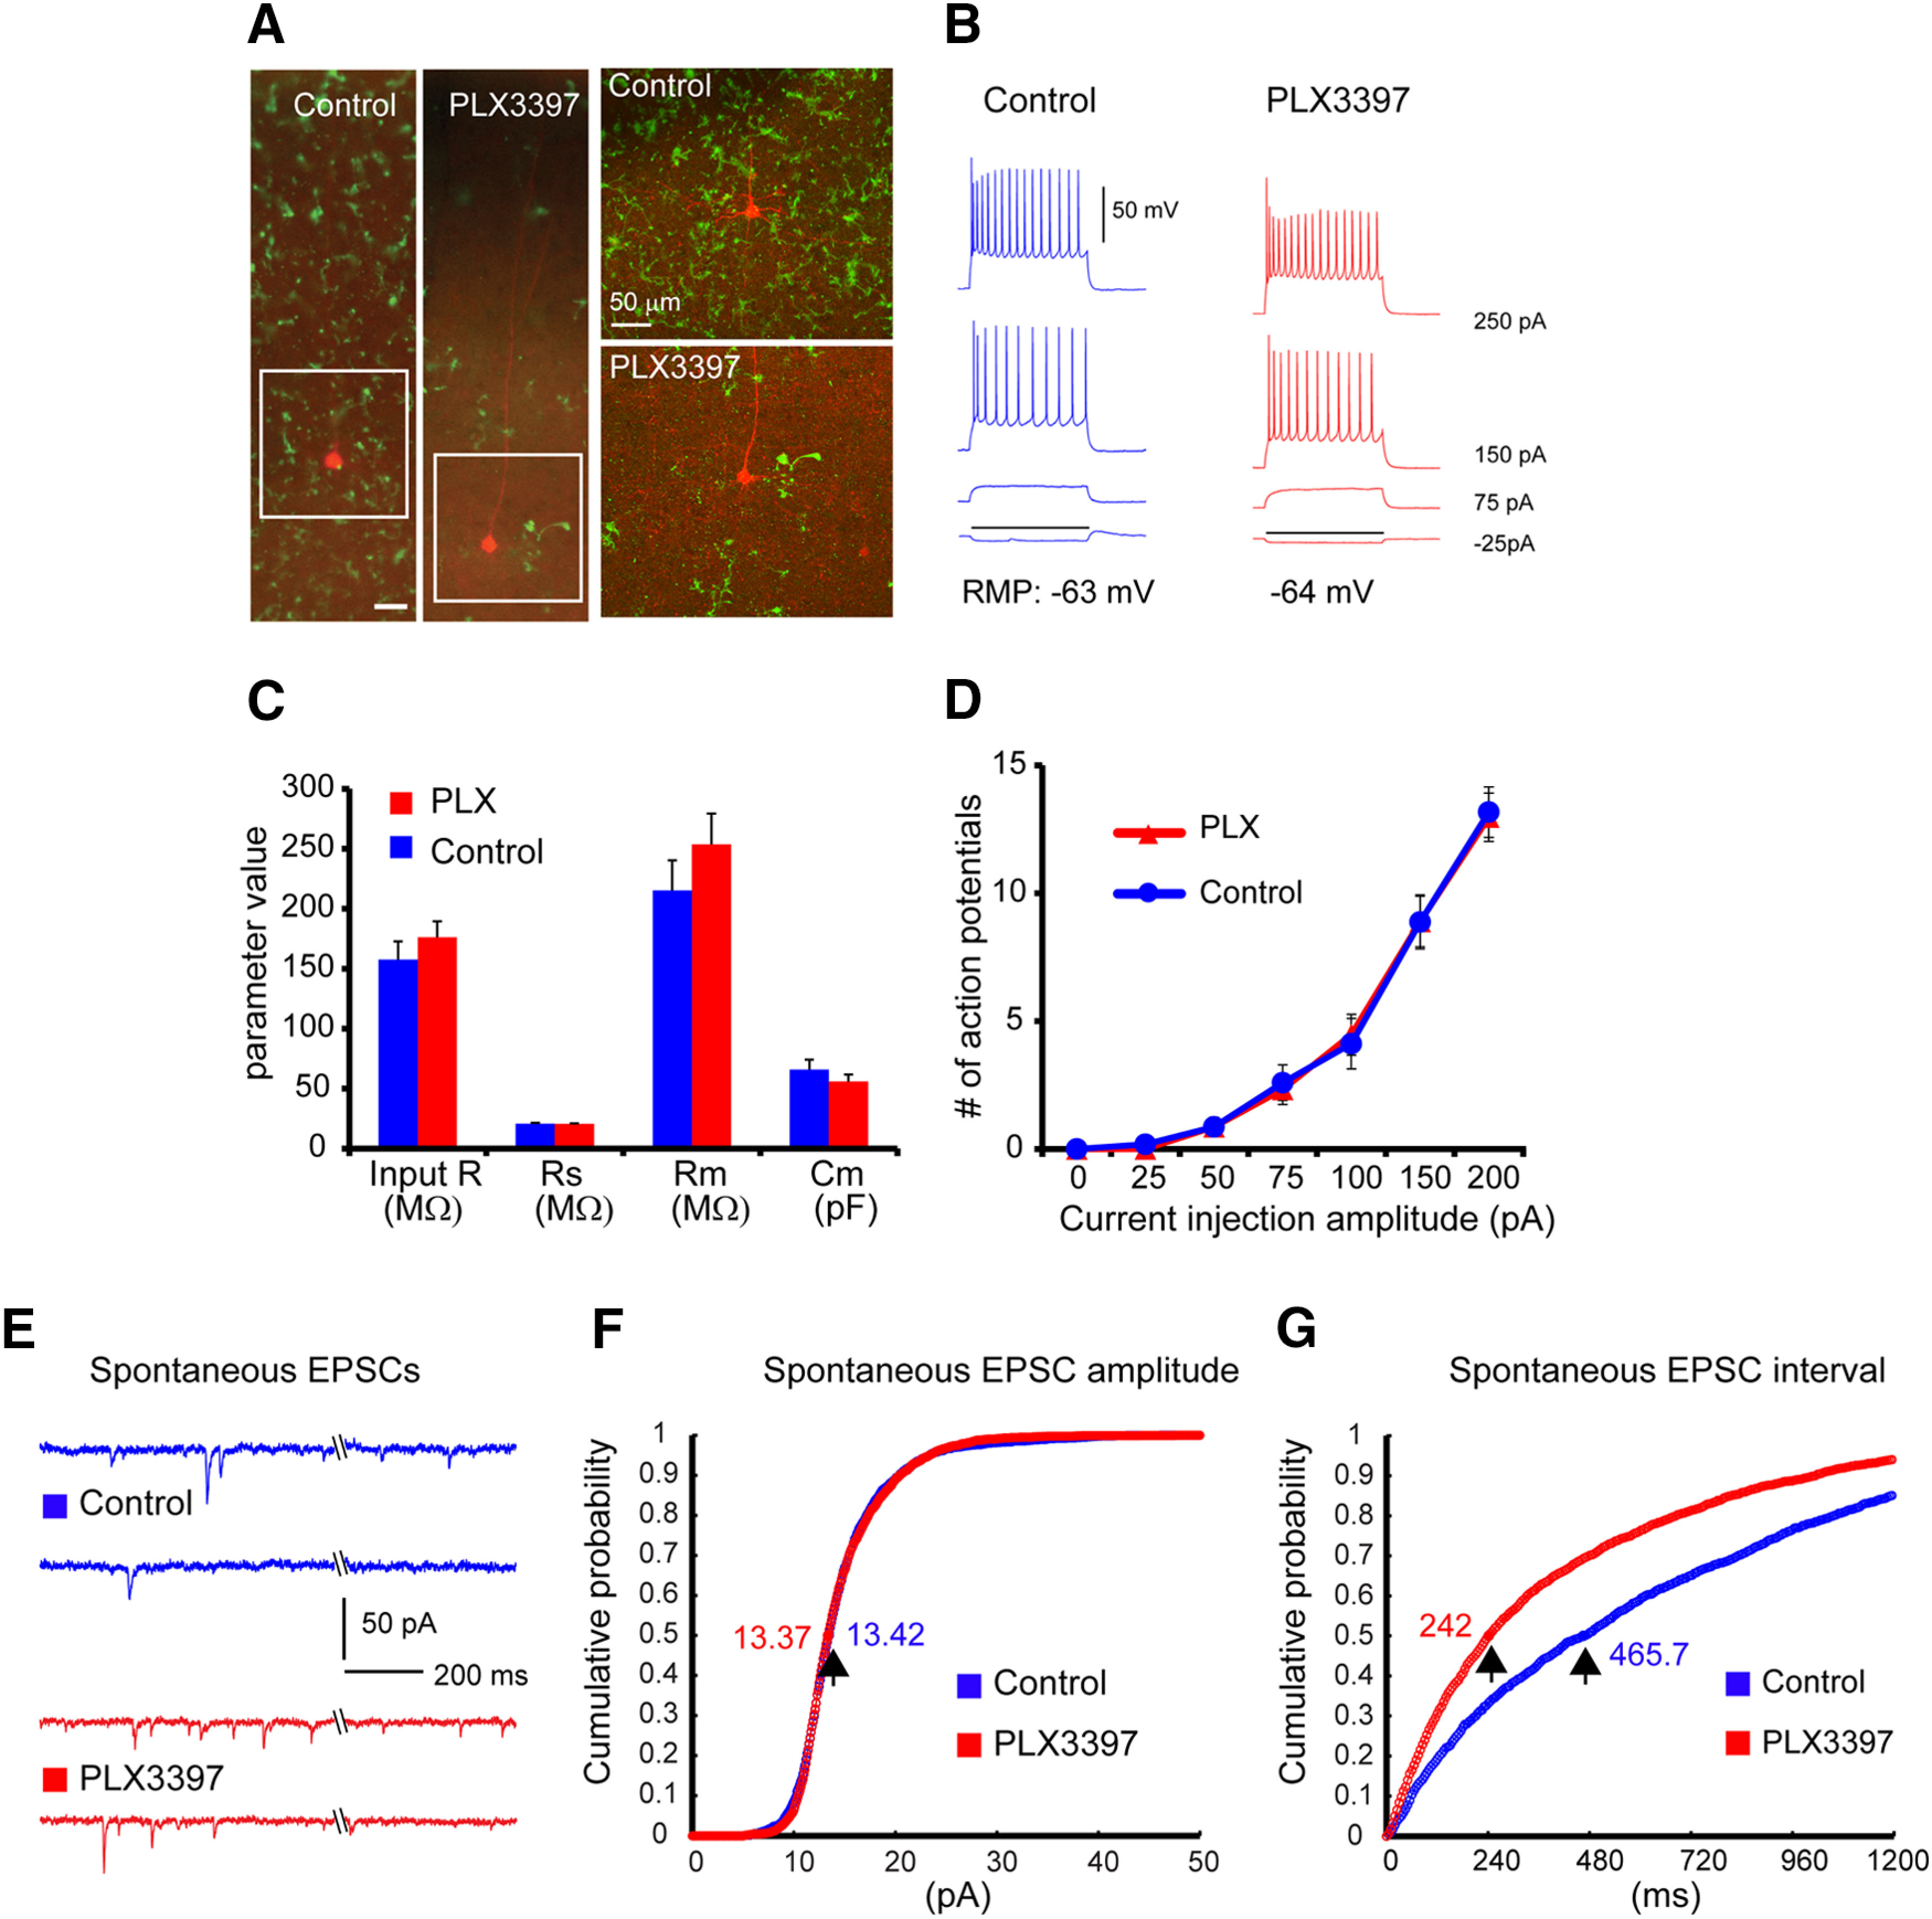
Spontaneous EPSCs increase substantially while intrinsic electrophysiological properties of excitatory pyramidal cells are not changed following 3- to 4-week-long PLX3397 treatment. A, Example cortical slice images of mice on PLX3397 show effective depletion of microglia cells, compared with control. The slices were postfixed after physiological recordings and immunostained against the microglia marker, IBA1. The recorded excitatory cells are visualized with biocytin staining (red); green represents microglial cells. Scale bar, 50 µm. B, Hyperpolarized and depolarized responses of the representative V1 layer 5 excitatory pyramidal cells in response to intrasomatic current injections. C, Comparison of average input resistance (input R), series resistance (Rs), membrane resistance (Rm), and membrane capacitance (Cm) between excitatory pyramidal cells of mice on PLX3397 (n = 12 cells from 4 C57BL/6 mice) and control (n = 12 cells from 3 C57BL/6 mice). Data are mean ± SEM. D, The current injection-response functions do not differ between the recorded cells from PLX3397-treated and control brain slices. E, Example traces showing spontaneous EPSCs from two representative neurons in control and PLX3397-treated mice. F, Cumulative probability plots of spontaneous EPSC amplitude distribution in control (blue curve) and PLX3397 (red curve) for 6 cells each. The cumulative probability curves overlap (Mann–Whitney U test; p = 0.796), and the amplitudes at the 0.5 cumulative probability essentially are the same (13.42 vs 13.37 pA) between control and PLX treatment. G, Cumulative distribution of spontaneous EPSC intervals in control (blue) and treated (red) conditions for 6 cells each. The cumulative probability curves differ clearly (Mann–Whitney U test; p = 5.59 × 10−169), with their intervals at the 0.5 cumulative probability being 465.7 ms versus 242 ms for control and PLX treatment, respectively.
