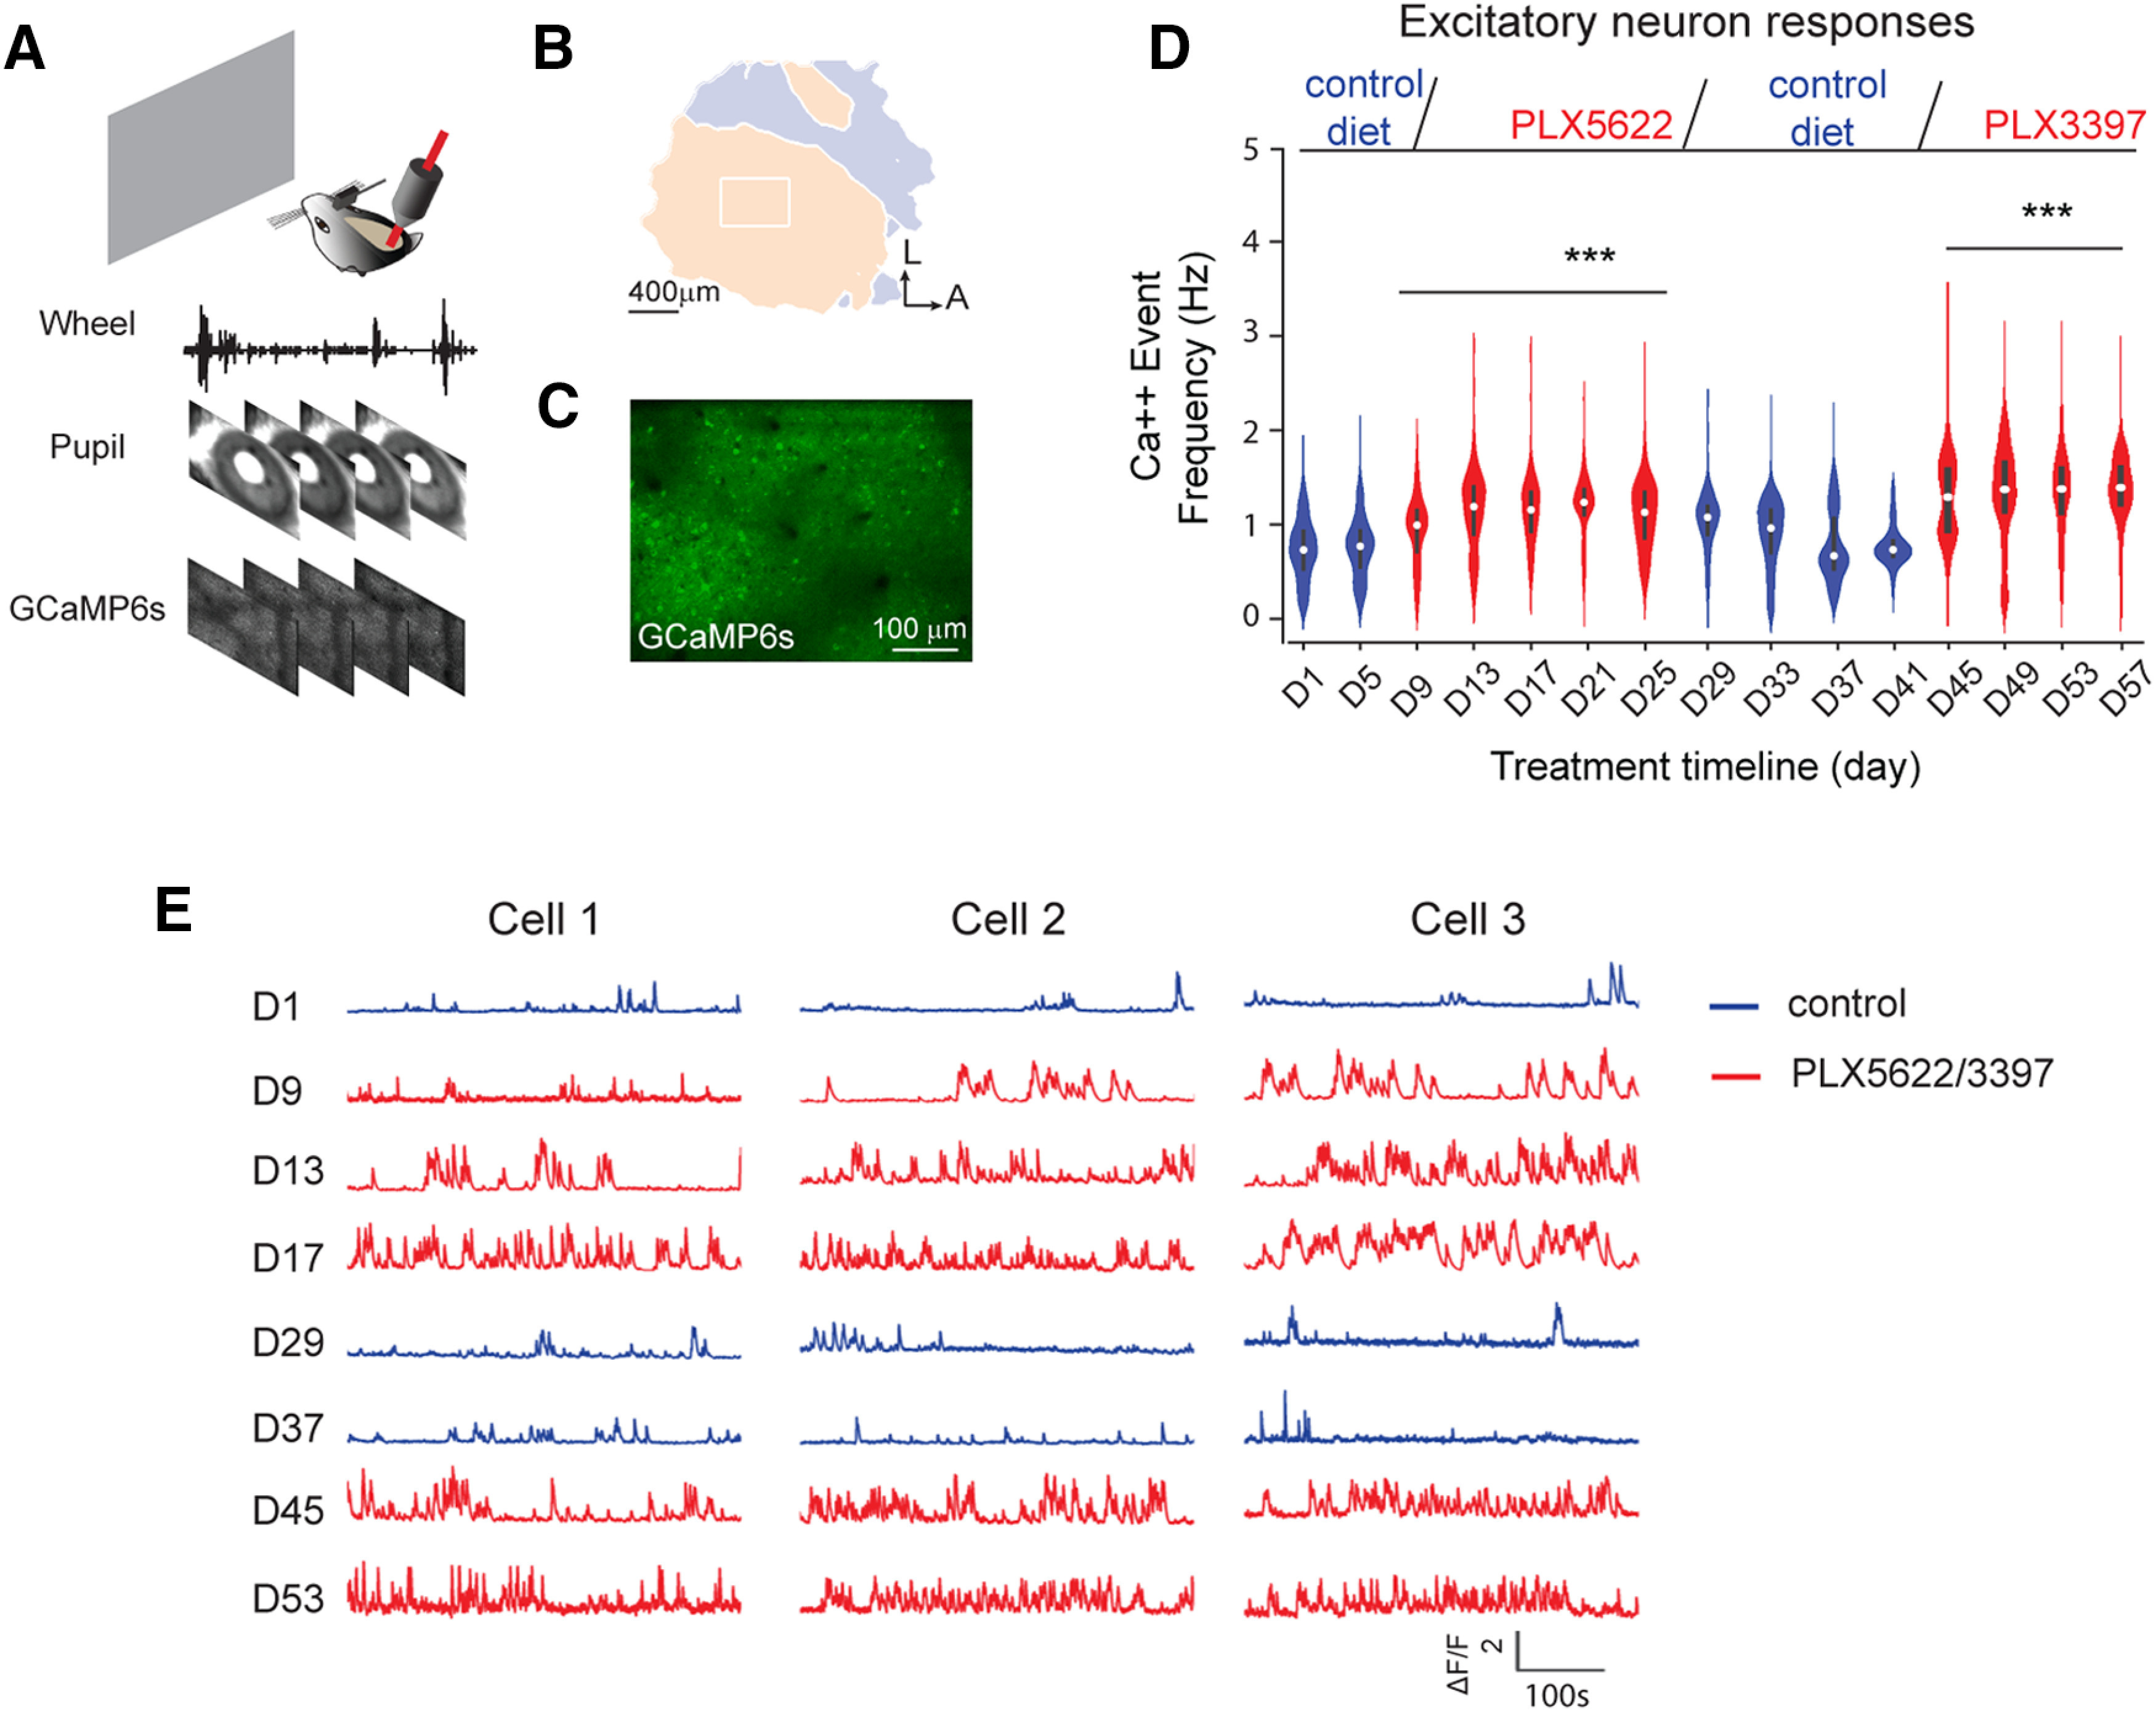
Figure 6.

In vivo two-photon calcium imaging reveals that microglia depletion enhances V1 excitatory neuron activity. A, A schematic illustration of in vivo two-photon imaging setup for a head-fixed awake mouse. During recording sessions, GCaMP6s calcium signals were recorded from V1 excitatory neurons; wheel tracking and pupil sizes were recorded simultaneously to determine animal running and eye movements. B, A color-coded visual field map of visual cortex (left) is mapped before two-photon imaging. The imaging area (the white rectangle) is located within binocular V1. C, A z-projection image from the top surface view of the mouse cortex expressing GCaMP6s in excitatory neurons. D, The violin plot graph of average calcium event frequencies of excitatory neurons (1144-1564 neurons from 5 mice; violin plot with median ± SEM) as the mice viewed a gray screen during different conditions, including 5 d of the control condition, 3 weeks of depletion of microglia with the PLX5622 treatment, 2 weeks of microglia recovery, and 2 weeks of microglia redepletion with PLX3397. Top, Experimental timeline. Blue violins represent control or microglia repopulation groups. Red violins represent microglia depletion conditions. Neural activity was recorded every 4 d, and was compared with neural activity on day 1 (D1) of control condition. Linear mixed-effects model analysis, overall: p = 5.19 × 10⁻³¹. ***p < 0.001. E, Example calcium activity traces of three representative V1 excitatory neurons under control, microglia depletion, microglia repopulation, and microglia redepletion conditions. Blue traces represent calcium activity under control or microglia repopulation condition. Red traces represent activity under microglia depletion conditions.
