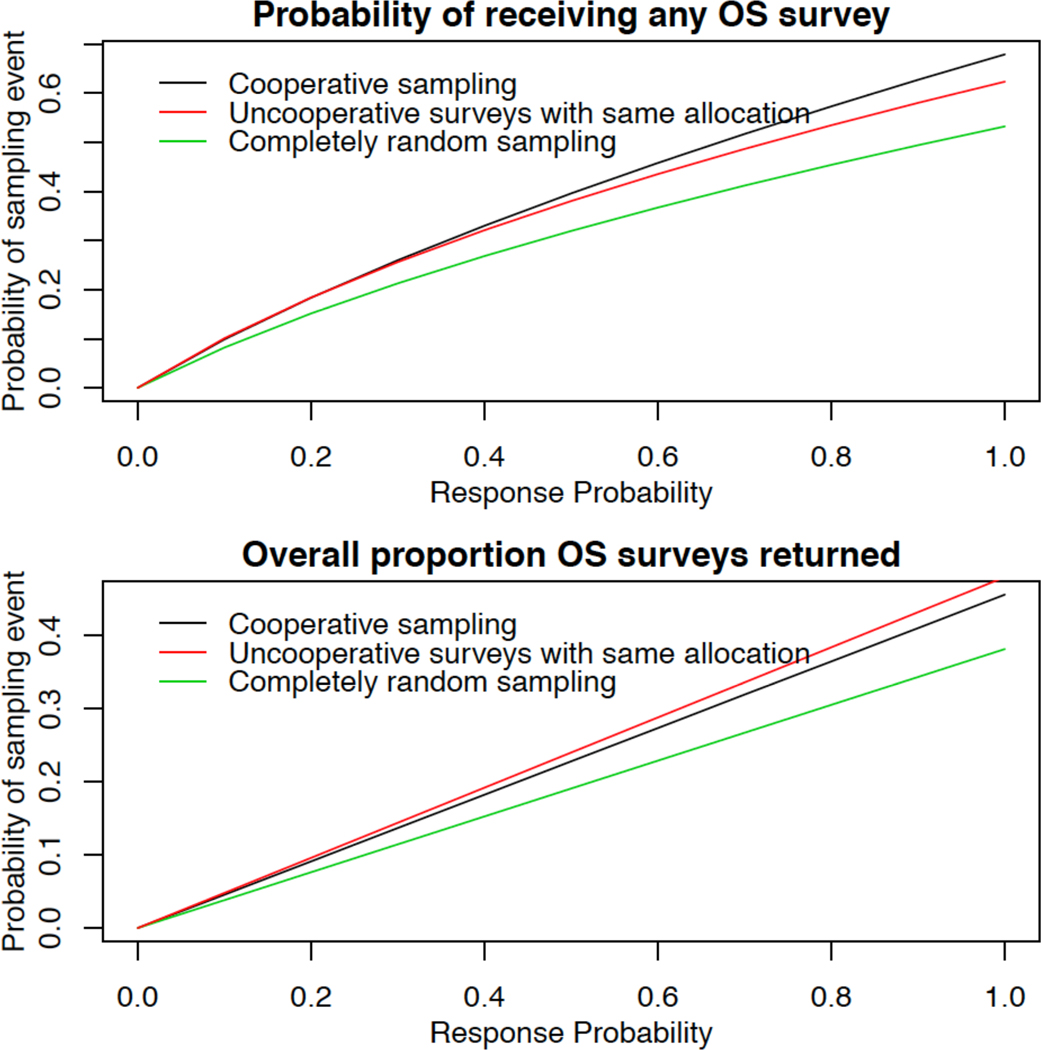
Figure 5:
The probability of a survey response from at least one OS (top) of a CP and the overall proportion of OS surveys returned (bottom) as a function of the response rate for three different sampling schemes. The sampling schemes are coupled sampling and two null or control schemes: non-coupled sampling with the same overall organization-type allocation as for coupled sampling and equal probability completely random sampling of all units.

