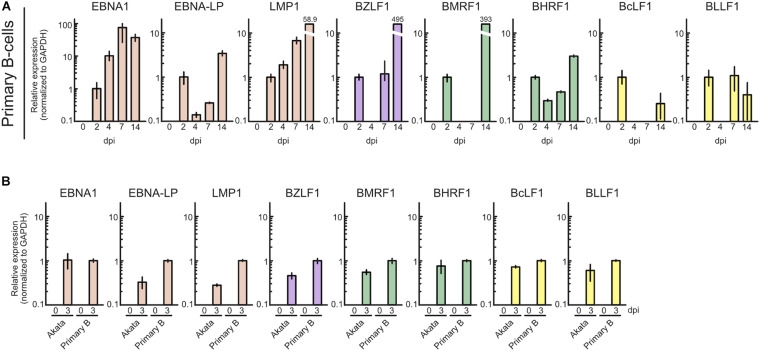
FIGURE 3.
Profile of EBV gene expression in the pre-latent phase of EBV infection of primary B-cells. (A) Purified primary B-cells were infected with EBV-EGFP and harvested at 0, 2, 4, 7, or 14 dpi. EBV gene expression was assessed by qRT-PCR and normalized to GAPDH expression. Results are presented as means ± SD of three independent experiments and are shown relative to gene expression at 2 dpi. (B) Akata(–) or purified primary B-cells were infected with EBV-EGFP and harvested at 0 and 3 dpi. EBV gene expression was assessed by qRT-PCR and normalized to GAPDH expression. Results are presented as means ± SD of three independent experiments. Abbreviations: dpi, day post-infection.

