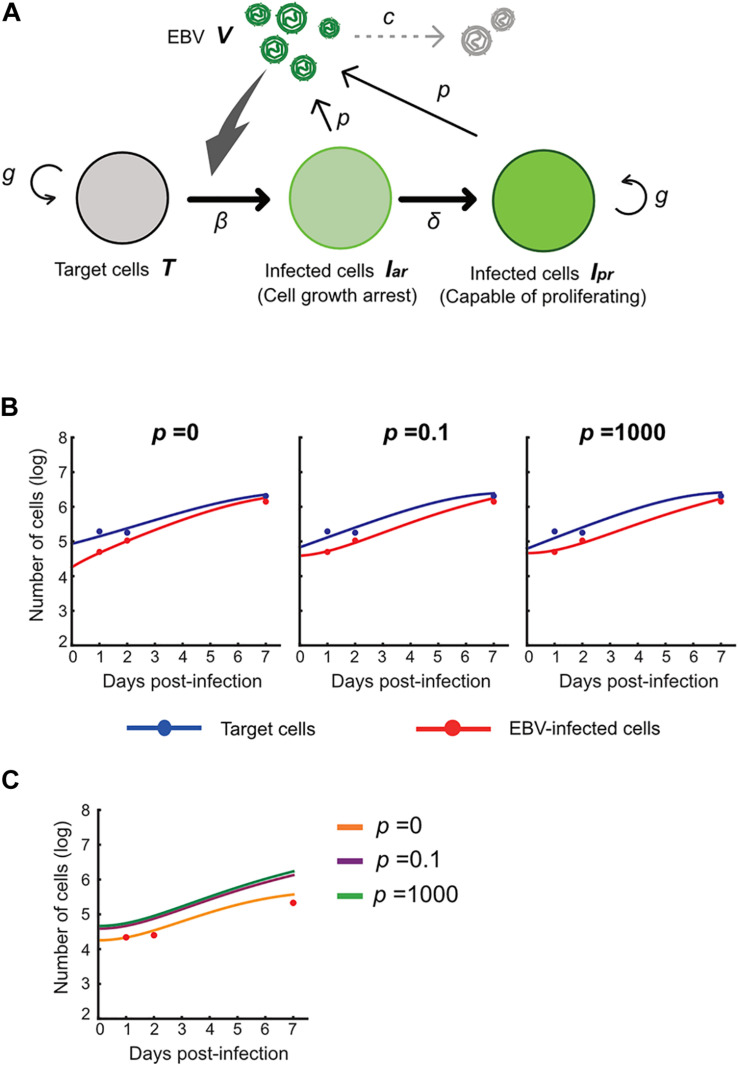
FIGURE 5.
Experimental mathematical investigation of progeny production during the pre-latent phase of EBV infection. (A) A mathematical model for EBV infection of B cells is described. The parameter g is the growth rate of cells, K is the carrying capacity, β is the cell-free infection rate, δ is the reciprocal number of the cell growth arrest period, p is the progeny virus production rate, and c is the decay rate of EBV. Note that p = 0 corresponds with no progeny virus production. (B) With fixed values of p = 0, 0.1 or 1,000, we fit Eqs (3–6) to the experimental data and describe the solid curves of the best-fit solution. (C) The number of infected cells was calculated from the mathematical model with estimated parameters. Except in the case of p = 0, prediction by the mathematical model could not property reproduce actual EBV infection dynamics properly.

