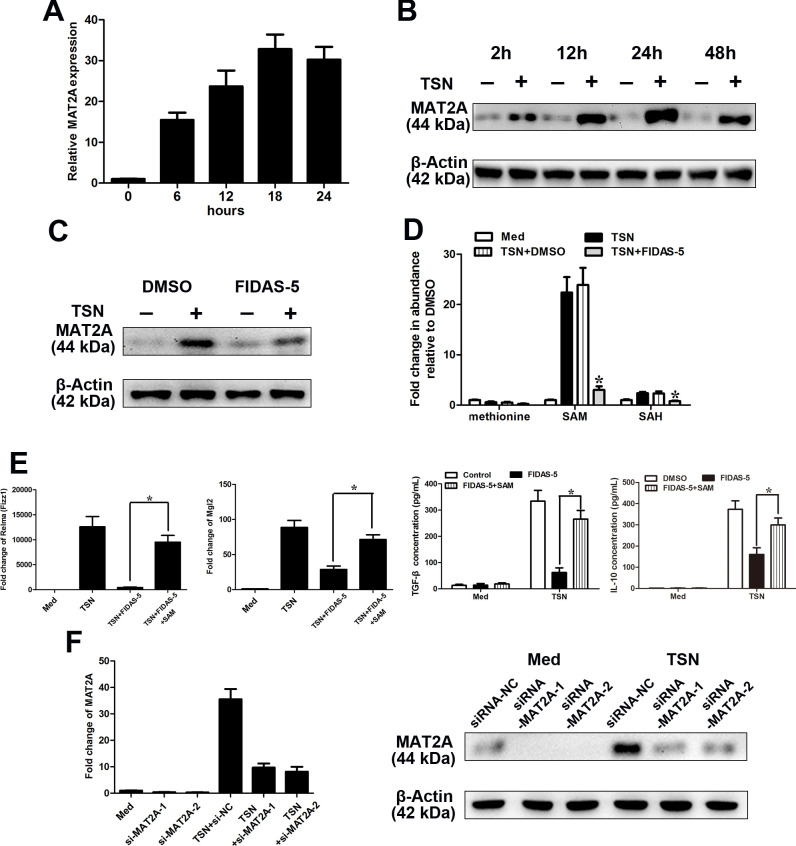
Figure 3.
MAT2A modulates the M2-phenotype of monocytes. (A–F) CD14+ cells were isolated from peripheral blood of healthy donors. (A, B) CD14+ cells were treated with MGC803 TSN for the indicated times, and the levels of MAT2A expression were determined by qRT-PCR (A) and western blotting (B) analysis. (C, D) CD14+ cells were left treated or untreated with MGC803 TSN for 20 hours in the presence or absence of FIDAS-5 treatment (10 µM). (C) The expression level of MAT2A was determined by western blotting. (D) LC-MS was used to determine the abundance of methionine cycle metabolites in CD14+ cells. Values were normalized to that in the absence of TSN. (E) CD14+ cells were left untreated or treated with MGC803 TSN for 20 hours in the presence or absence of FIDAS-5 treatment (10 µM) or SAM supplementation (500 µM). Levels of the M2-associated genes Relma, Mgl2 by qPCR and IL-10 and TGF-β production by ELISA. (F) CD14+ cells were transfected with siRNA-NC or siRNA-MAT2A and then untreated or treated with TSN for 28 hours. The expression levels of MAT2A were determined by qRT-PCR (left panel) and western blotting (right panel). Data are presented as the mean±SD; *p<0.05. N=3 biologically independent experiments. MAT2A, methionine adenosyltransferase II alpha; SAM, S-adenosylmethionine; TSN, tumor culture supernatant.

