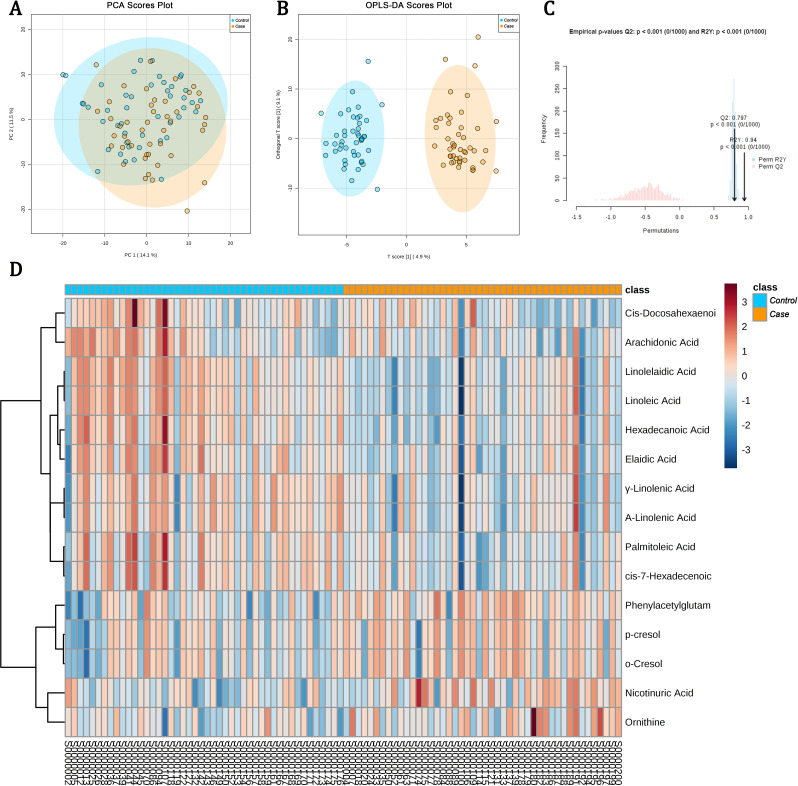
Figure 1.
Metabolomic data analyses based on the discovery set. (A) Score plot of the principal component analysis (PCA) model; (B) score plot of the orthogonal partial least squares discriminant analysis (OPLS-DA) model, and the R2 was 0.97 and the Q2 was 0.65 calculated by 10-fold cross-validation; (C) results of 1000-time permutation test of the OPLS-DA model, and the empirical p values for R2Y and Q2 were all <0.001. The blue dots represent the samples of type 2 diabetes mellitus (T2DM) without diabetic retinopathy (DR) (controls), and the yellow dots indicate the samples of DR (cases); (D) heatmap for intensities of metabolomics-based markers identified in the discovery set. The heatmap presents relative peak areas of the final 15 detected differential metabolites between DR and T2DM without DR based on the discovery set. With colors changing from red to blue, red and blue colors mean upregulated and downregulated metabolites in the serum sample of patients with DR, respectively.

