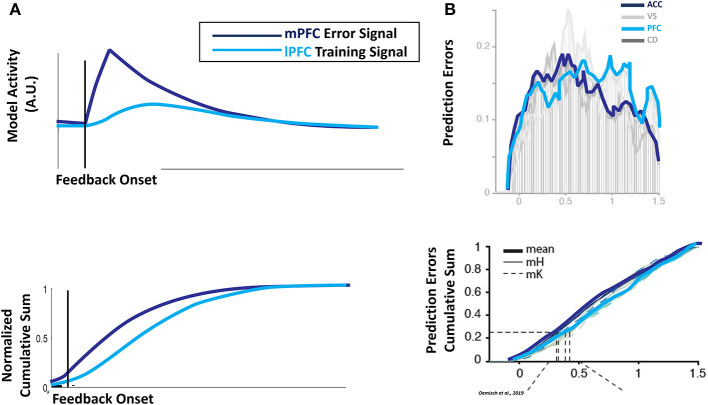
Figure 5.
Temporal dynamics of error and prediction. (A) Performance-related error signals in the model mPFC at the lowest hierarchical level evolve rapidly following the onset of feedback, peaking soon after the onset of task feedback (top panel, dark blue line) and tailing off rapidly (bottom panel, dark blue line). Proxy outcomes used to train superior hierarchical levels in lPFC are a composite of error signals calculated by inferior levels and the contents of WM, with a consequent lag in the temporal profile (top panel, light blue line) and lingering activity (bottom panel, light blue line). (B) The relative temporal profiles of error and composite training signals matches reward predictions errors observed in monkey mPFC and lPFC performing the reversal task, with spiking activity for prediction error units peaking in mPFC/ACC prior to lPFC (top frame) and prolonged activity in lPFC relative to ACC/mPFC (bottom frame). Figures adapted with permission from Oemisch et al. (2019).

