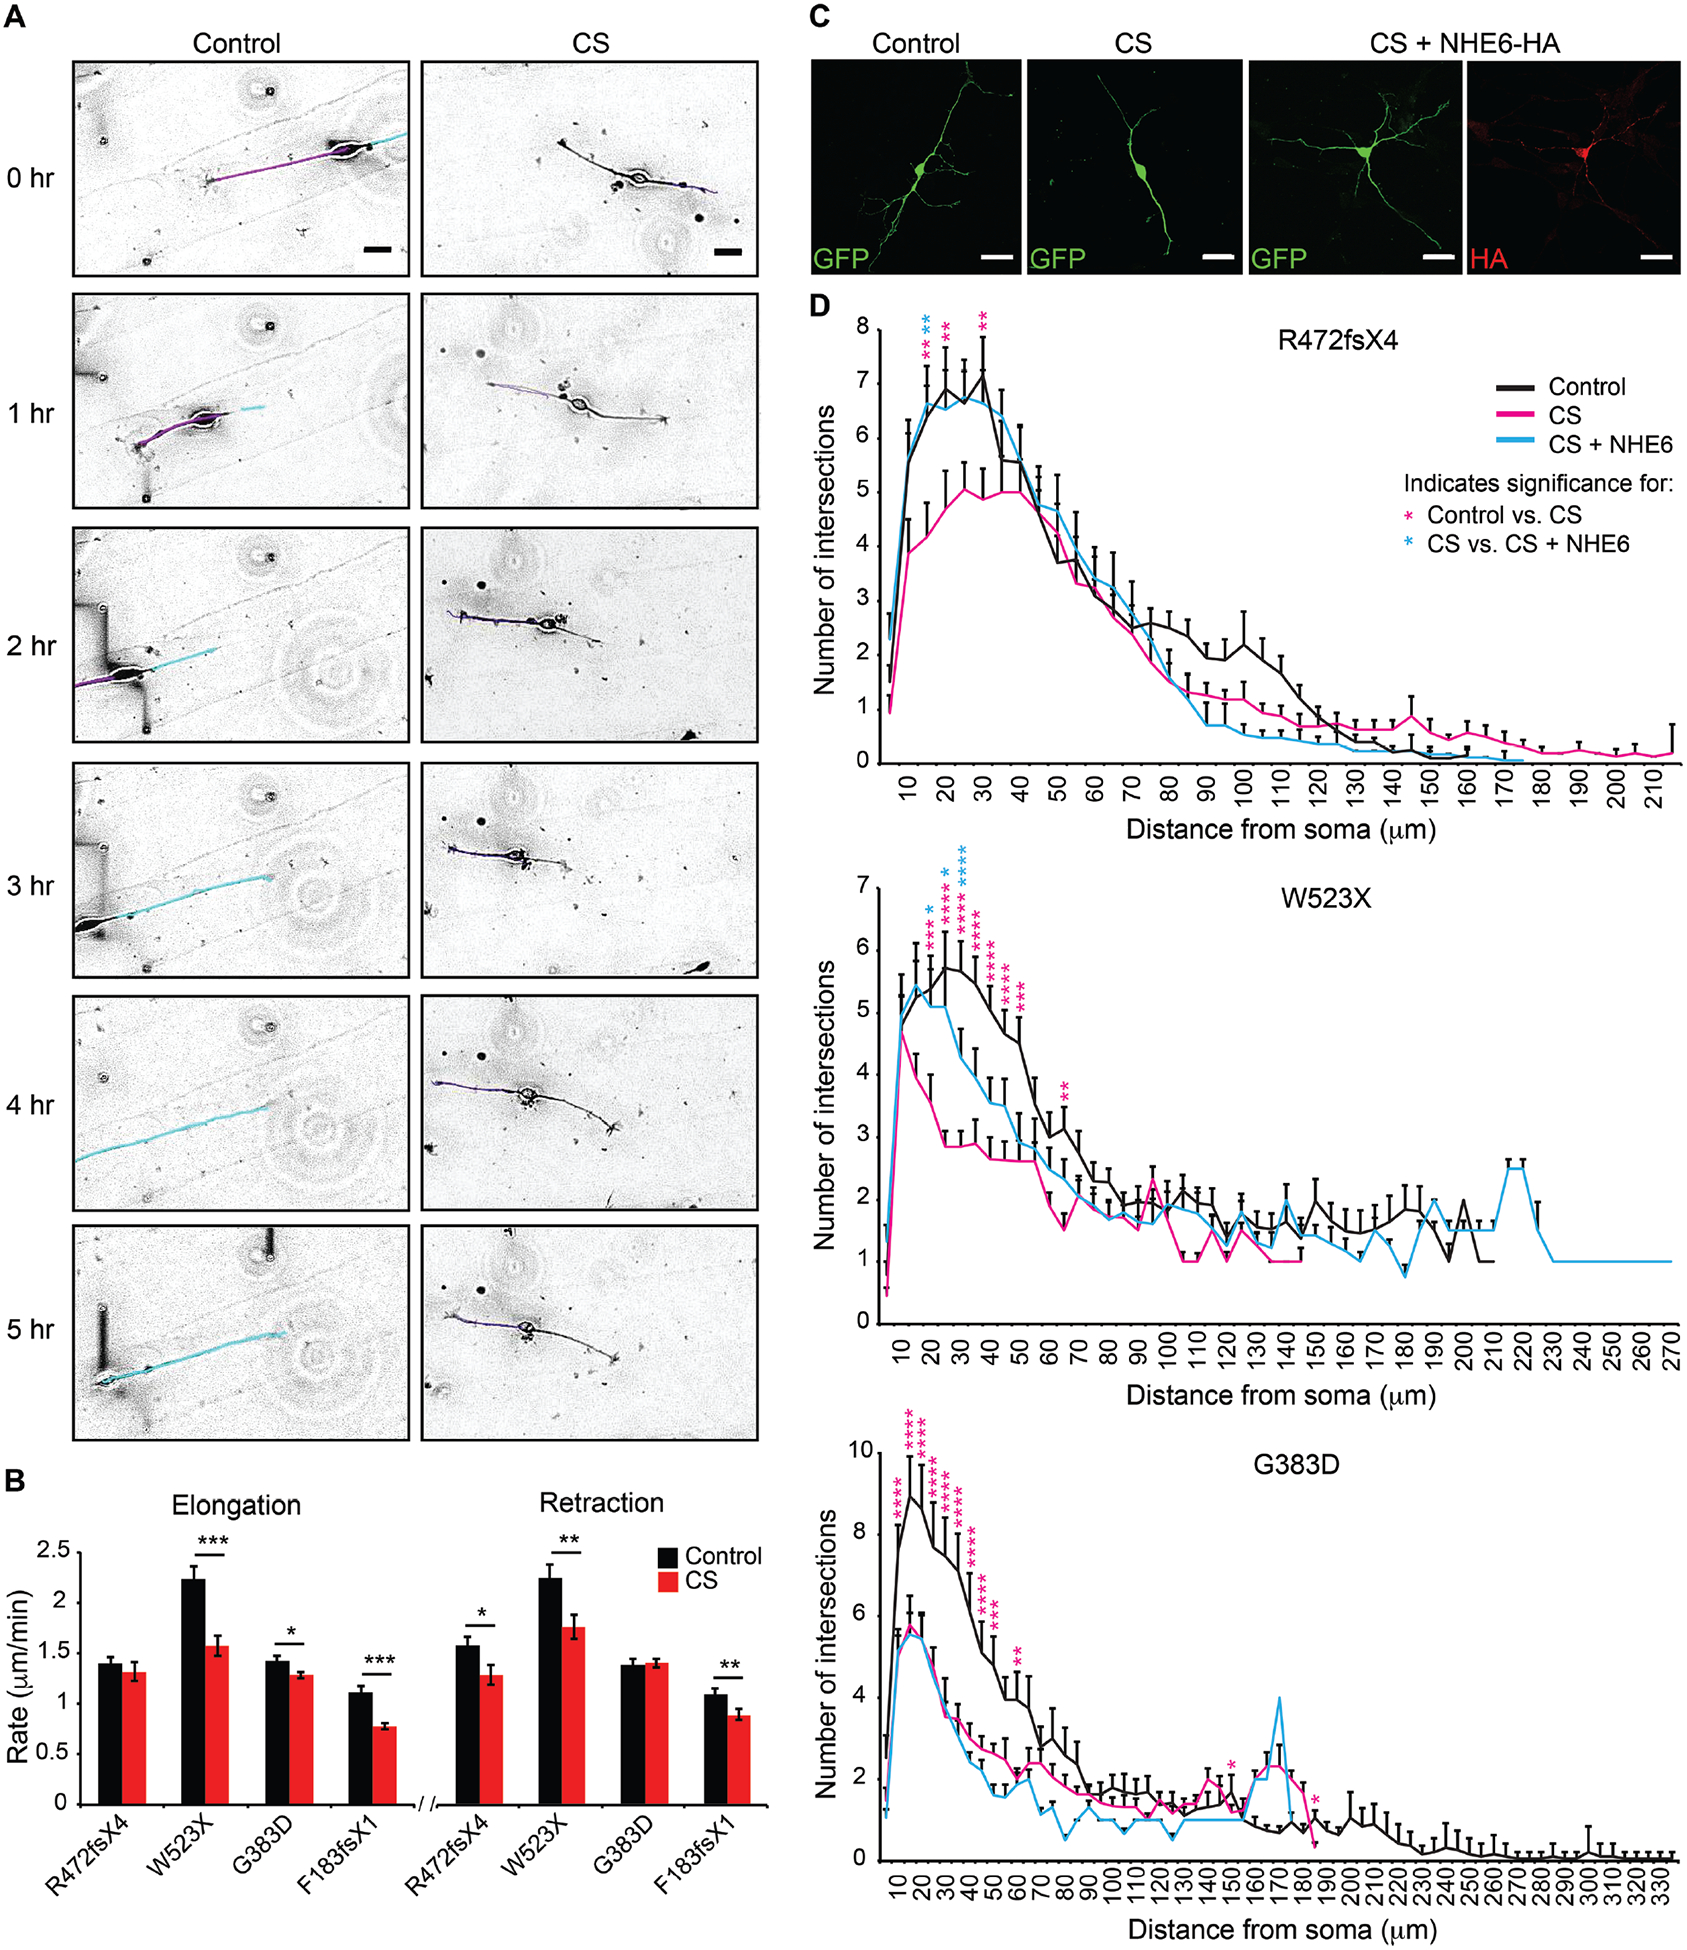
Fig. 3. Rescue of deficits in neuronal arborization by re-expression of NHE6 in CS lines with frameshift or nonsense mutations but not in the CS missense mutation line.

(A) Neurite outgrowth dynamics were monitored in iPSC-derived neurons. Time-lapse images of iPSC-derived neurons plated on laminin-striped coverslips were acquired using Volocity software at four XY positions every 5 min for 12 hr. Representative images are shown from the CS and paired control lines for Family 3, G383D. Tracings of neurites are shown in purple and cyan for the control line to demonstrate tracking of different neurites. Scale bars, 20 μm. (B) The rates of neurite elongation and retraction were measured using ImageJ software for the first 2 hr. Control Family 1: n = 17 cells/ 32 neurites/ 841 measurements; Family 1, R472fsX4: n = 13 cells/ 25 neurites/ 875 measurements; Control Family 2: n = 12 cells/ 15 neurites/ 635 measurements; Family 2, W523X: n = 8 cells/ 9 neurites/ 724 measurements; Control Family 3: n = 28 cells/ 55 neurites/ 827 measurements; Family 3, G383D: n = 52 cells/ 126 neurites/ 2,163 measurements; Control Family 4: n = 8 cells/ 17 neurites/ 622 measurements; and Family 4, F183fsX1: n = 9 cells/ 13 neurites/ 708 measurements. (C) Representative images reflective of each condition of gene transfection experiments are shown from Family 1, R472fsX4. iPSC-derived neurons were transfected with a construct encoding for GFP alone or with two constructs together encoding for GFP + full-length human NHE6-HA and analyzed after 5 days. Scale bars, 20 μm. (D) Sholl analysis of control iPSC-derived neurons (black lines), CS iPSC-derived neurons (magenta lines), and CS iPSC-derived neurons transfected with a construct encoding for NHE6-HA (cyan lines) was performed. The average number of neurite intersections with Sholl radii was plotted as a function of distance from the soma for each condition. n = 20–25 cells per condition. Data represent means ± SEM. Welch’s t tests (B) and two-way ANOVA followed by Bonferroni correction for multiple comparisons (D) were used. * P < 0.045, ** P < 0.008, *** P < 0.00008 (B). * P < 0.05, ** P < 0.01, *** P < 0.0001, **** P < 0.00001 (D). Magenta asterisks denote significance when comparing CS to control cells. Cyan asterisks denote significance when comparing CS to CS cells transfected with a construct encoding for NHE6-HA.
