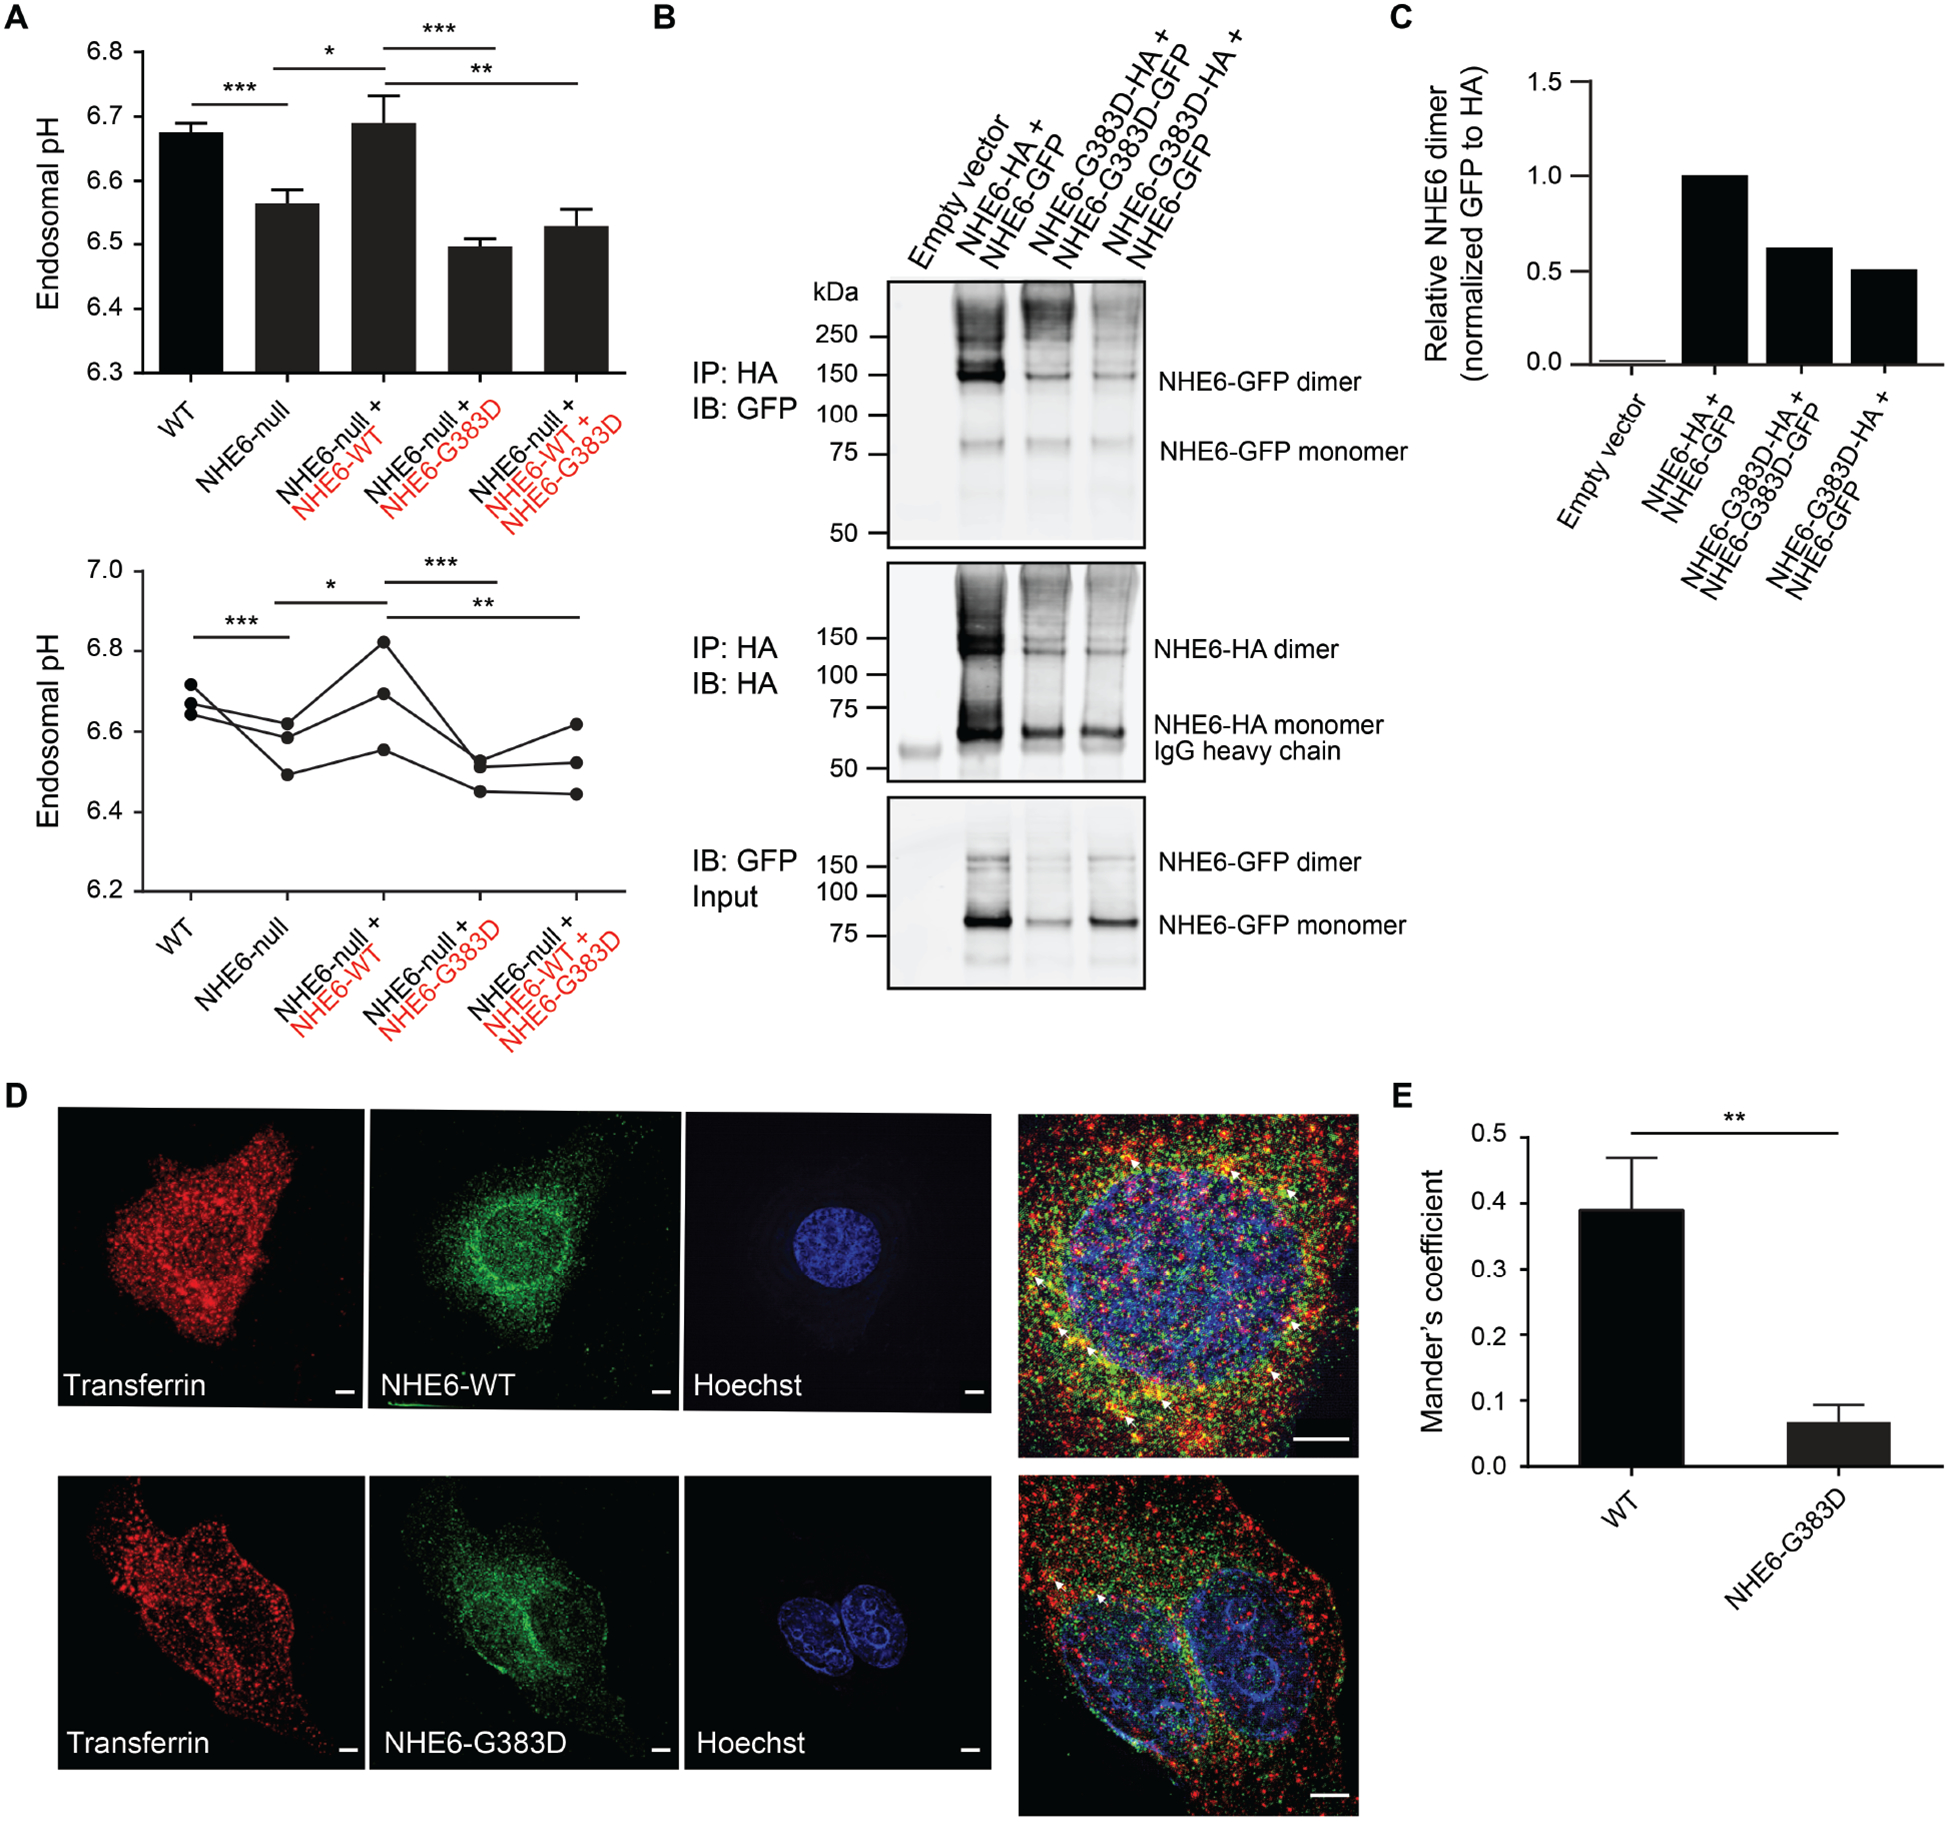
Fig. 4. Loss-of-function and dominant-negative activity of NHE6 G383D mutation in regulation of intra-endosomal pH, and mislocalization in cells.

(A) The ability of NHE6 G383D-mutant protein to rescue endosomal pH defects in NHE6-null HEK293T cells was determined. Endosomal pH was assayed using a transferrin-based method in which cells were incubated with pH-sensitive and pH-insensitive fluorescent conjugates of transferrin and then analyzed by flow cytometry. Endosomal pH was measured in wild-type HEK293T cells (WT) (black font), HEK293T cells lacking NHE6 by way of gene editing (NHE6-null) (black font), and HEK293T cells lacking NHE6 but expressing mCherry-tagged WT (red font) and/or G383D-mutant NHE6 (red font). Data are presented as a bar graph (top) and as individual data points wherein each dot represents the average of three replicates from one independent experiment (bottom). n = 3 experiments. (B) Lysates from HEK293T cells expressing HA- or GFP-tagged forms of NHE6, as indicated, were immunoprecipitated using an anti-HA antibody and subsequently analyzed by western blot using antibodies against GFP (top panel) and HA (middle panel). Protein input was determined by western blot of lysates that had not undergone immunoprecipitation for HA-tagged protein using an antibody against GFP (bottom panel). (C) The relative amount of immunoprecipitated NHE6 dimer was quantified based on results shown in panel (B). (D) HeLa cells expressing HA-tagged WT or G383D-mutant NHE6 were incubated with Alexa Fluor 568-conjugated transferrin (red) for 10 min and subsequently immunostained for HA (green) and imaged using srSIM. Arrows (white) in the magnified images indicate areas of co-localization between transferrin and NHE6 in endosomes. Scale bars, 5 μm. (E) Co-localization of NHE6 WT protein vs. NHE6 G383D-mutant protein with transferrin was quantified using ImageJ, and a Mander’s coefficient was determined. Data represent means ± SEM. Unpaired Student’s t tests were used. * P < 0.05, ** P < 0.01, *** P < 0.001.
