
FIGURE 1.
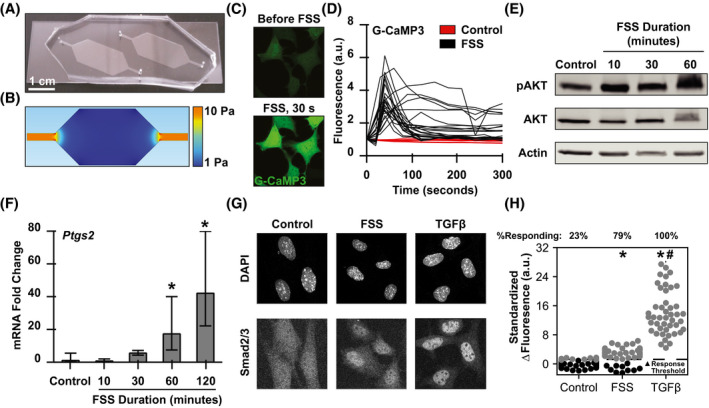
FSS rapidly induces nuclear translocation of Smad2/3 in OCY454 cells. A, B, Fluid flow through the elongated hexagonal polydimethylsiloxane (PDMS) microfluidic chambers designed and used in FSS experiments was modeled using COMSOL. C, D, Images and fluorescence intensity quantification of individual OCY454 cells transfected with the calcium reporter G‐CaMP3 prior to and following stimulation with 0.1 Pa FSS, normalized to initial cellular intensity (n = 3‐6 biological replicates). E, Western analysis of AKT phosphorylation following stimulation with 0.1 Pa FSS. F, qRT‐PCR analysis of mechanoresponsive gene Ptgs2 following stimulation with 1 Pa FSS, normalized to control cells. G, Representative images of Smad2/3 nuclear localization in control cells or following 30‐minute treatments with FSS (0.1 Pa) or TGFβ (5 ng/mL). H, Fluorescence quantification on individual OCY454 cells showing differences in (nuclear‐cytosolic) Smad2/3 intensity and %responding cells per condition (standardized to controls, n = 3 biological replicates). *P < .05 compared to unstimulated cells and #P < .05 compared to FSS‐stimulated cells