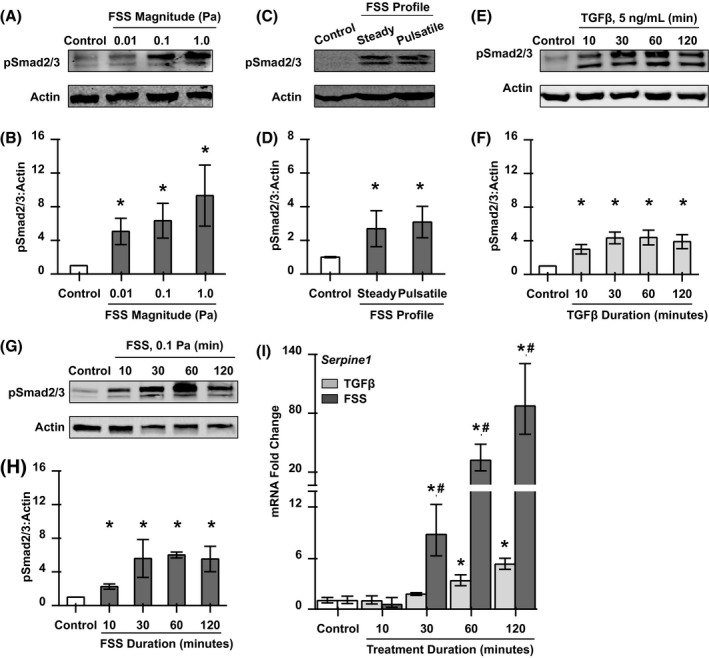
FIGURE 2.

TGFβ and FSS exhibit overlapping, but distinct, responses in OCY454 cells. A‐H, Western analysis and quantification of Smad phosphorylation in OCY454 cells grown in control conditions or following stimulation with steady or pulsatile (1 s on, 1 s off) FSS for 30 minutes as labeled (A‐D), or a time course of TGFβ treatment (E, F) or FSS stimulation (G, H). FSS profile is steady unless otherwise indicated. I, qRT‐PCR analysis of TGFβ pathway target gene Serpine1 in control, TGFβ‐treated, or FSS‐stimulated cells. All values normalized to control cells. *P < .05 compared to unstimulated cells and #P < .05 compared to TGFβ‐treated cells
