
FIGURE 3.
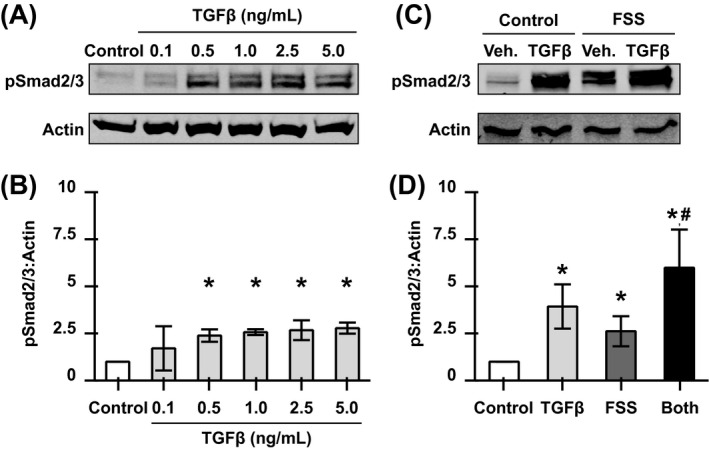
Concurrent stimulation with FSS and TGFβ results in higher levels of phosphorylated Smads than either treatment alone. A, B, Western analysis and quantification of control or TGFβ‐treated OCY454 cells grown in cell culture dishes for 30 minutes, normalized to control cells. C, D, Western analysis and quantification of OCY454 cells grown in microfluidic devices in the absence of stimulation or following 30‐minute treatment with TGFβ (5 ng/mL) and/or FSS (0.1 Pa). All values normalized to control cells. *P < .05 compared to unstimulated cells and #P < .05 compared to FSS‐stimulated group