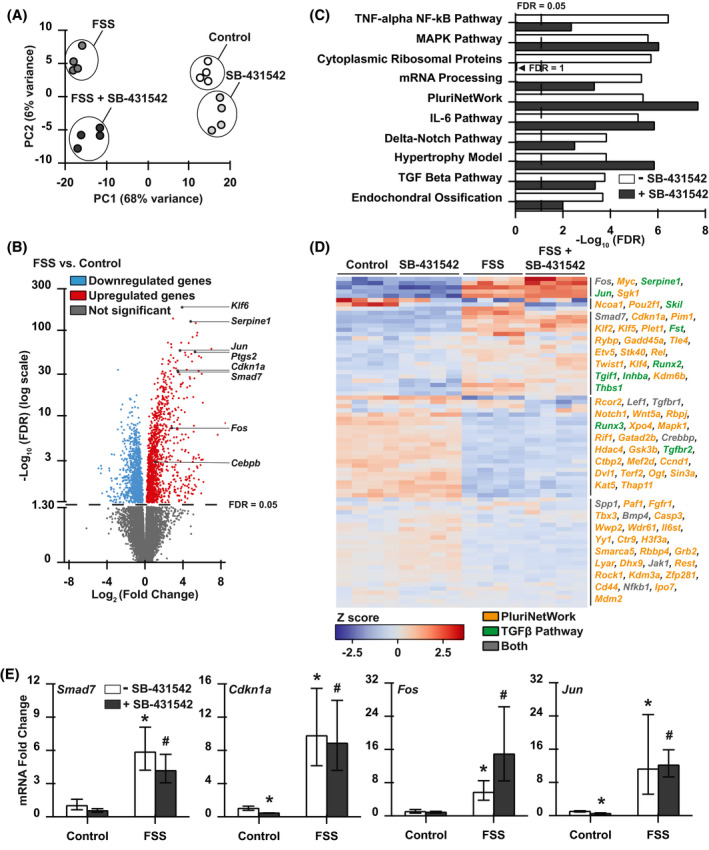
FIGURE 6.

RNA‐seq analysis supports potent FSS regulation of TGFβ superfamily signaling. A, Principal component analysis of sample variation considering the 500 genes with greatest variance. B, Volcano plot showing the distribution of differential gene expression in FSS‐stimulated and unstimulated cells, and identifying induced (red) and repressed (blue) differentially expressed genes (DEGs). C, Enrichr pathway analysis using the WikiPathways database reveals the top ten most significantly regulated pathways, including TGFβ, that remain significantly regulated even in the presence of SB‐431542. D, Genes related to the TGFβ and PluriNetWork pathways were clustered in a heatmap, and genes in each cluster are grouped. E, qRT‐PCR analysis of established TGFβ‐inducible genes Smad7, Cdkn1a, Fos, and Jun following FSS stimulation in the presence or absence of SB‐431542. Vehicle is 1% of DMSO. Dotted lines on graphs indicate threshold for statistical significance (FDR < 0.05). *P < .05 compared to unstimulated cells and # P < .05 compared to SB‐treated controls
