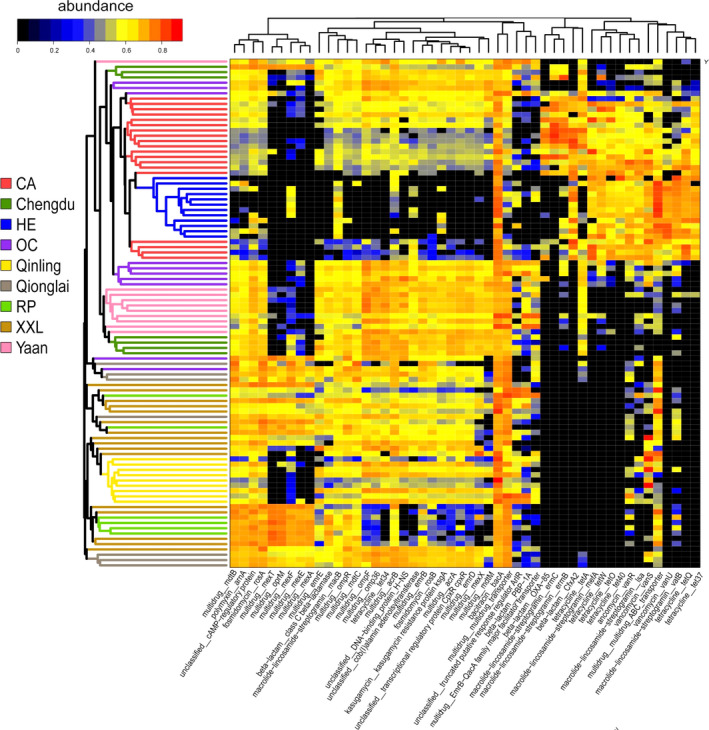
Fig. 4.

The heatmap of the top 50 ARG subtypes in the 96 metagenomes studied. The left tree is a neighbour‐joining tree constructed using the Jaccard distance of the ARG subtype abundance, with each colour representing one group. In the main figure, each row represents one metagenome. Each column represents one ARG subtype. In order to display the heatmap clearly, the abundance was transformed from the original abundance using the following formula: lg(original abundance x 1000).
