Figure 1. .
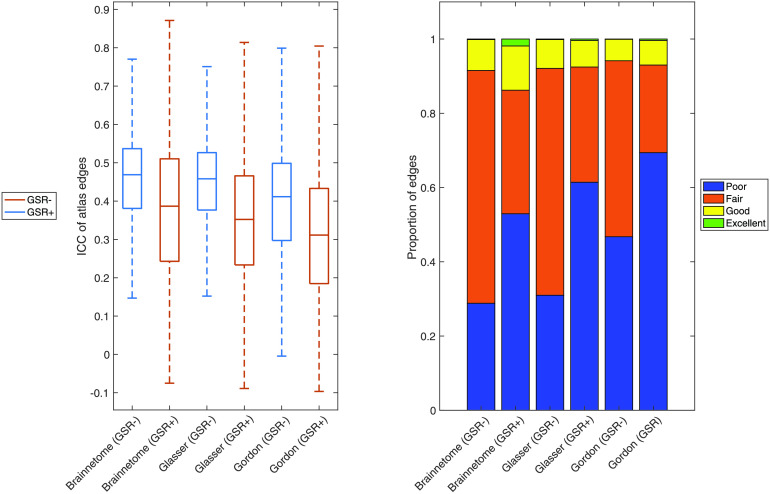
Reliability of functional connectome edges. Left: For the Brainnetome, Glasser, and Gordon atlases with and without performing GSR, we show boxplots of ICC of all atlas edges. Right: For the Brainnetome, Glasser, and Gordon atlases with and without performing GSR, we show the proportion of edges having poor (ICC < 0.40), fair (ICC = 0.40–0.60), good (ICC = 0.60–0.75), or excellent (ICC > 0.75) reliability, defined in accordance to Cicchetti (1994). GSR− = no global signal regression; GSR+ = global signal regression; ICC = intraclass correlation coefficient.

