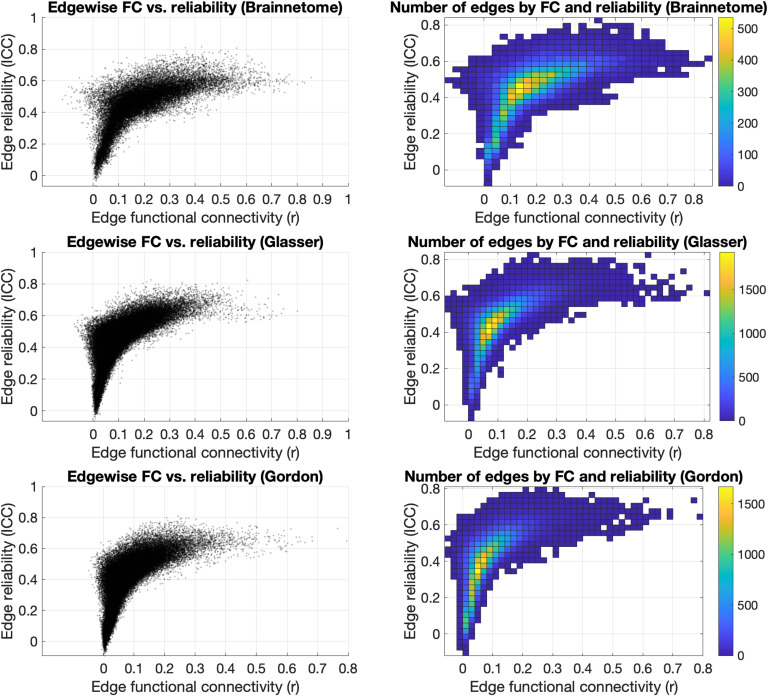
Figure 6. .
Effects of edge strength on reliability. Plotting the strength of each edge of the Brainnetome, Glasser, and Gordon atlases versus their ICC (left) showed that edges with higher FC were mostly in the “fair” reliability range (ICC = 0.40–0.60). FC of edges with higher reliability (ICC > 0.7) were mostly between r = 0.10 and r = 0.70, and edges with very low reliability (ICC < 0.30) also had low FC (r < 0.20). The distribution of edges (right) had its highest density in an interval of r = 0.10–0.30 and a corresponding reliability ranging from “poor” to “fair” (ICC = 0.30–0.50). FC = functional connectivity; ICC = intraclass correlation coefficient; r = Pearson correlation coefficient.

