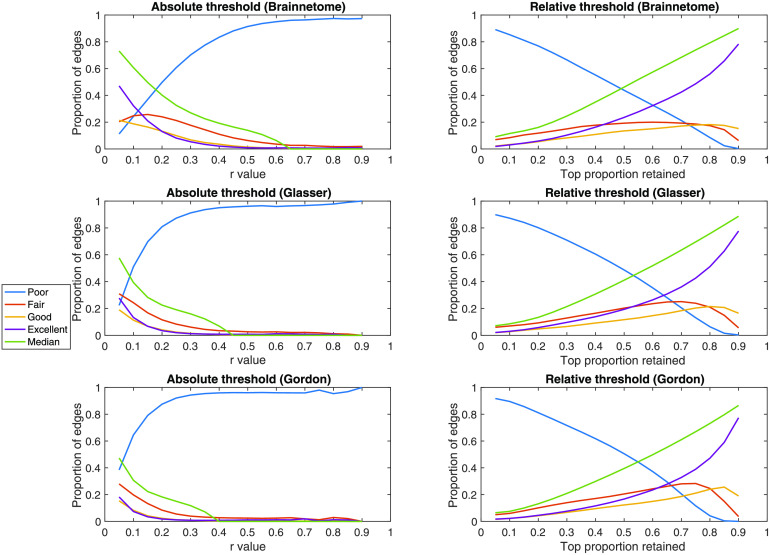
Figure 7. .
Effects of thresholding on edge retention. In the Brainnetome, Glasser, and Gordon atlases, for each absolute and relative threshold we show the proportion of edges that are consistently retained. As a measure of consistency, we use the number of participants in which the edge was retained at both time points divided by the ones in which it was retained at least once. For convenience, we then use the values defined in Cicchetti (1994) to plot the ratio of edges having poor (ratio < 0.40), fair (ratio = 0.40–0.60), good (ratio = 0.60–0.75), or excellent (ratio > 0.75) consistency. For absolute thresholds (left) all edges below the value are set to 0; for relative ones (right) only the top percent corresponding to the threshold is retained. r = Pearson correlation coefficient.

