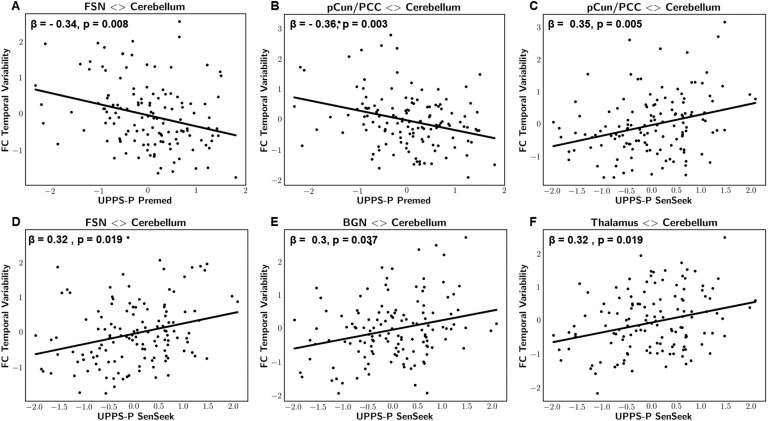
Figure 4. .
Scatterplot representations of statistically significant associations between dynamics of cerebro-cerebellar FC and UPPS-P measures: sensation seeking and lack of premeditation. Panels A and B represent temporal variability in FSN-cerebellum and pCun/PCC-cerebellum FC strength vs. UPPS-P lack of premeditation, respectively. Panels C, D, E, and F represent temporal variability in FSN-cerebellum, pCun/PCC-cerebellum, BGN-cerebellum, and thalamus-cerebellum FC strength vs. UPPS-P sensation seeking, respectively. All variables were adjusted for age, gender, and mean framewise displacement and presented as z-scores. β: standardized regression coefficient, p: FWE-adjusted p values.

