
Figure 2: The gut microbiome is not required for recruitment and activation of thermogenic tissues.
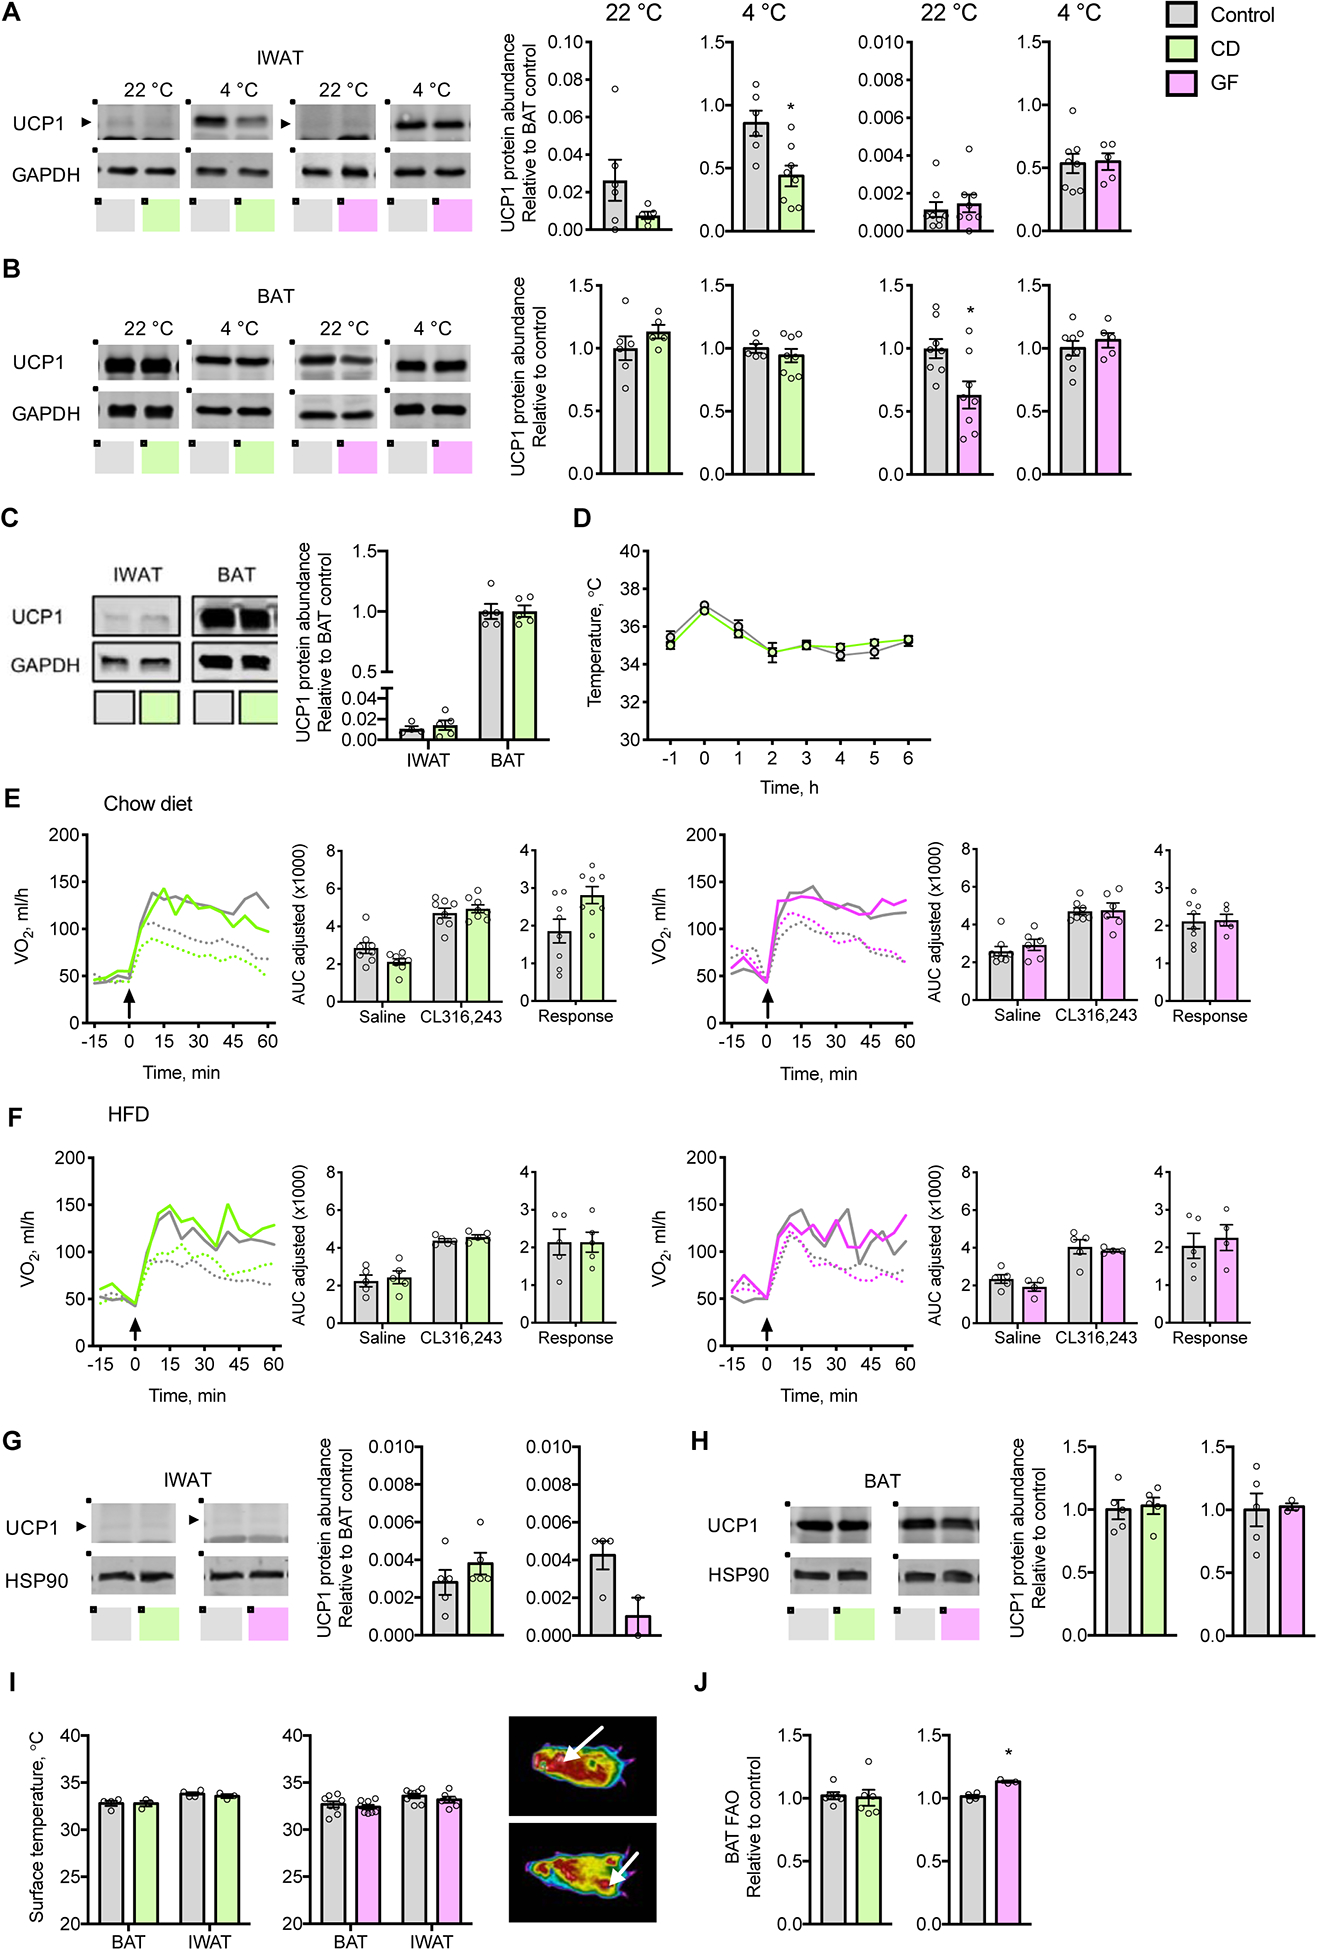
(A and B) Representative immunoblots and quantification of UCP1 protein expression in (A) IWAT and (B) BAT of chow fed CD mice treated for 40 d with antibiotics and GF mice, acclimated to 22 °C or 4 °C (n = 5–8).
(C) Representative immunoblots and quantification of UCP1 protein expression in IWAT and BAT of CD mice exposed to 4 °C for 48 h (n = 5).
(D) Core body temperatures prior to and during acute cold challenge at 4 °C (n = 5).
(E and F) VO2 values in response to subcutaneous injection (arrow) of CL316,243 (solid line) or saline (dotted line) in (E) mice fed chow and acclimated to 22 °C and (F) mice fed palm oil-based HFD for 4 w and acclimated to 30 °C; Inset barplots display the AUC for saline and CL316,243 as well as the response, AUC of saline subtracted from CL316,243 (n = 4–8).
(G and H) Representative immunoblots and quantification of UCP1 protein expression in (G) IWAT and (H) BAT of CD and GF mice acclimated to 30 °C and fed a palm oil-based HFD for 4 w (n = 3–6).
(I) Representative image and surface temperatures of BAT and IWAT in mice acclimated to 22 °C. Arrow indicates BAT (upper panel) and IWAT (lower panel) (n = 3–6).
(J) Rates of FAO in BAT (n = 4–6).
AUC values were adjusted by ANCOVA for corrected body mass. Circles represent individual mice; Barplots represent means ± s.e.m; Solid and dashed lines represent means. Statistical analyses were conducted using Student’s t-test or 2-way ANOVA with repeated measures where appropriate; *P < 0.05 control vs. CD or GF mice. See also Figure S2.